

R-13 Risk Bulletin – May 2021
May 14, 2021
Objective
The objective of the Monthly Risk-Bulletin is to provide an overview a) of lessons learned during the past month in the project, b) of a score-card-type system to communicate the state of risk of supply chains impacted by COVID-19 supporting health infrastructure and the workforce between the U.S. and Mexico, and c) of a communication system to facilitate the restoration of broken supply chains and the formation of new ones to reactivate trade between U.S. and Mexico. The report aims to offer valuable insights to the general public and decision-makers towards informed preventive actions to reduce the current pandemic’s potential impact on critical supply chains and better strategize about feasible social, economic, and environmental risk-mitigating actions against COVID19 and converging threats. This bulletin is jointly produced by the project’s PIs, the project’s contractors, and the U.S. binational task force serving as advisors to the project.
| Project PIs | |
|---|---|
| Zenon Medina-Cetina, PhD – PI | Gregory Pompelli, PhD – Co-PI |
| Matt Cochran, DVM, MIA – Co-PI | Maria Jose Perez-Patron, PhD – Co-PI |
| Miriam Olivares, GISP – Co-PI |
| Document prepared with the support of: | Reviewed & Approved by: |
| Enrique Z. Losoya, Guillermo Duran, Juan Pablo Alvarado, Barnett Jimmy | Dr. Medina-Cetina – PI |
| PhD Students SGL – Research Assistants | Date: 05/14/2021 |
Suggested citation:
Medina Cetina, Z., Pompelli, Gregory., Cochran, Matt., Olivares, Miriam., Perez-Patron, Maria J., Duran, Guillermo., Alvarado, Juan Pablo., Z-Losoya, Enrique., & Lopez-Acosta, Araceli. (2021). CBTS-SGL Monthly Risk Bulletin: May. https://r13-cbts-sgl.engr.tamu.edu/
@misc{Medina2021,
   author = {Medina Cetina, Z. and Pompelli, Gregory and Cochran, Matt and Olivates, Miriam, Perez-Patron, Maria J. and Duran, Guillermo and Alvarado, Juan Pablo and Alexi, Allen, and Torres, Cesar, and Barnett, Jimmy, and Lopez-Acosta, Araceli, and Sanchez-Siordia, Oscar, and Rojas, Minerva and Zarate-Losoya, Enrique},
   title = {*CBTS-SGL Monthly Risk Bulletin: May.*},
   url={https://r13-cbts-sgl.engr.tamu.edu/},
   year={2021},
   month={May}
}- Objective
- Introduction
- I. Project Status & Lessons Learned
- II. Risk Communication Mechanism
- III. Restoration and Creation of Supply Chains
- References
Introduction
This was an important month for the taskforce. New members were added, models are beginning to be validated by teams of experts, and work continues to be done on the development of the dashboards, platforms and indices associated with our project.
I. Project Status & Lessons Learned
Research Briefs on BN Model Variables and Indices
Contributing Milestone 3: Datalake
1. Estimation of excess mortality associated with COVID-19 for Mexico and the U.S.
- Introduction
When combining international data, the issue of differing standards and variables implemented in the computing of indices and approximations, which make it difficult to integrate these datasets in a unified, mathematically consistent way.
- Objectives
To integrate the excess mortality rates for the US and Mexico, who use two different methods.
- Methodology
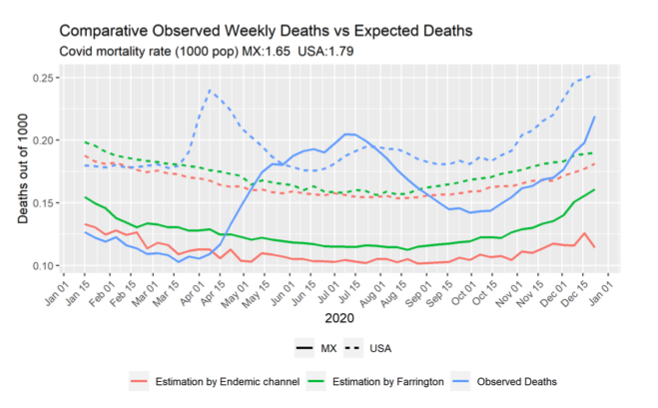
The excess mortality is defined as the difference between the observed and the expected deaths in a period. Two techniques are employed to compute the excess mortality: Farrington’s method and the endemic channel procedure. In Farrington’s method, the expected deaths are given by the upper limit of a 95% prediction interval for the mean of a quasi-Poisson regression with a linear time trend and a seasonal factor for the weekly death count data. In the endemic channel method, the expected deaths correspond to the 90% percentile of the weekly historical mortality data. Both methods are adjusted from all- cause mortality data of the years 2015-2019. The United States Centers for Disease Control and Prevention (CDC) utilizes Farrington’s method, while the Mexican government uses the endemic channel procedure. Both methods will be utilized on both datasets to compare and contrast results and determine which is the most accurate and representative of the data.
- Results
Farrington’s method indicates that in 2020 Mexico and the U.S. exceeded the number of expected deaths by 20% and 12%, respectively. The Endemic Channel method indicates that Mexico exceeded the expected deaths by 39%, while the U.S. by 17%. (Figure 1) presents the 2020 observed deaths count and the corresponding expected deaths for Farrington’s and the endemic channel algorithms for both countries (solid lines for Mexico, dashed lines for the U.S.). The pandemic’s effect hit the U.S. in the middle of March.
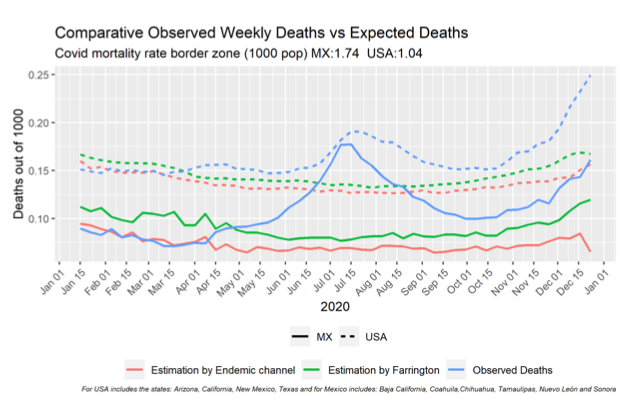
(Fig. 2) shows a comparison between the mortality excess measured in the border states of Mexico and the U.S.
- Conclusion
Farrington’s method showed that the U.S. and Mexico exceeded the number of excess deaths by a lower percentage than the Endemic Channel method.
2. Index of stringency in containment measures, their impact on economic activity and mobility reduction
- Introduction
During the COVID-19 pandemic, governments took different measures to combat the pandemic. In this section, we will be reviewing the effects these combative measures had on various economic and social factors.
- Objectives
To explore the association between the government’s response to contain the pandemic and measurements of mobility reduction, economic activity, and unemployment.
- Methodology
-
Stringency index of containment measures: This index is estimated by the project “The Oxford COVID-19 Government Response Tracker”. The index is based on collected information for nine indicators related to the governments’ containment measures to mitigate COVID-19’s pandemic.
-
Economic activity index: In the case of Mexico, we use the Global Economic Activity Index (IGAE by its Spanish initials), which measures the evolution of multiple economic sectors and is expressed as percentage terms regarding the activity levels of 2013. For the United States, we use the – Industrial Production index, which measures the evolution in the manufacturing, mining, electricity, and gas utility sectors. The index is also expressed in percentage terms referencing 2012.
-
Mobility reduction index: We use the mobility index in workplaces published by Google’s local mobility report. The mobility index is inverted for its interpretation as a reduction in mobility; in this way, it is also interpreted as an indicator of the adoption of measures to contain the epidemic (the higher the values, the greater the adoption by the population).
- Results
(Fig. 3) shows the change in the stringency of the containment measures over time. In Mexico, the strictest level was reached during the first months of the pandemic. The measures were relaxed after June 2020, and the lowest levels of stringency were reached from February 2021. The maximum level of rigor negatively impacted the IGAE index, (Fig. 4), which fell up to 22 percentage points with respect to the pre-pandemic levels.
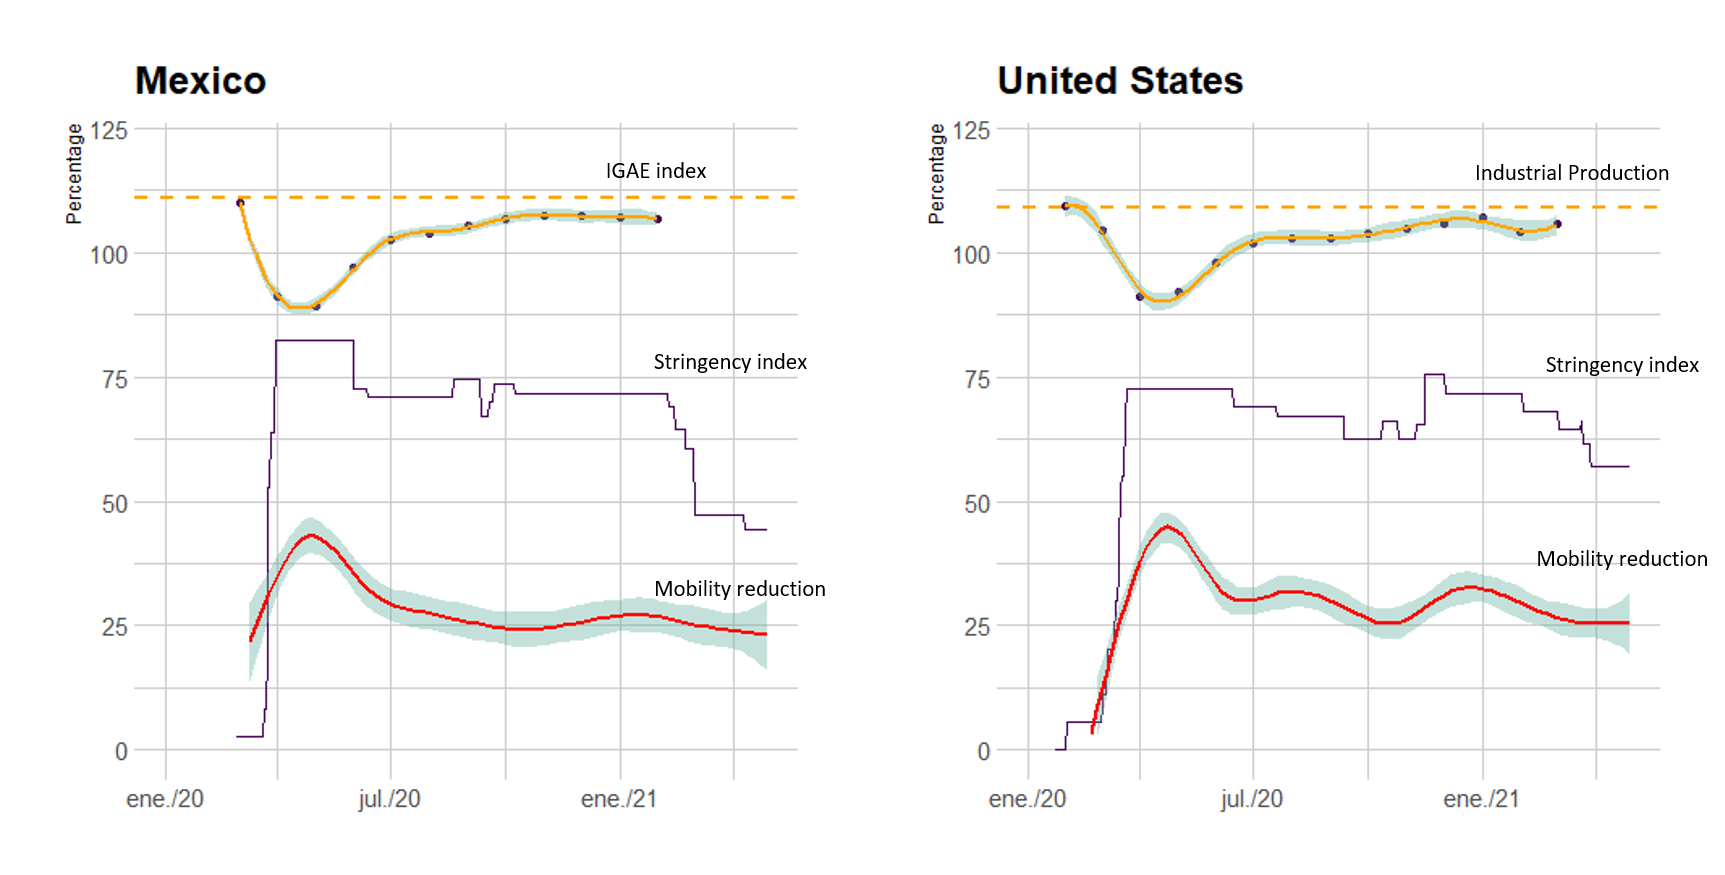
The United States reached a moderately high level of stringency of the containment measures at the pandemic’s beginning. From June 2020, the measures were relaxed; however, the initial rigor was recovered during November and December 2020. As in Mexico, the Industrial Production index was negatively affected, falling 18 percentage points in April 2020.
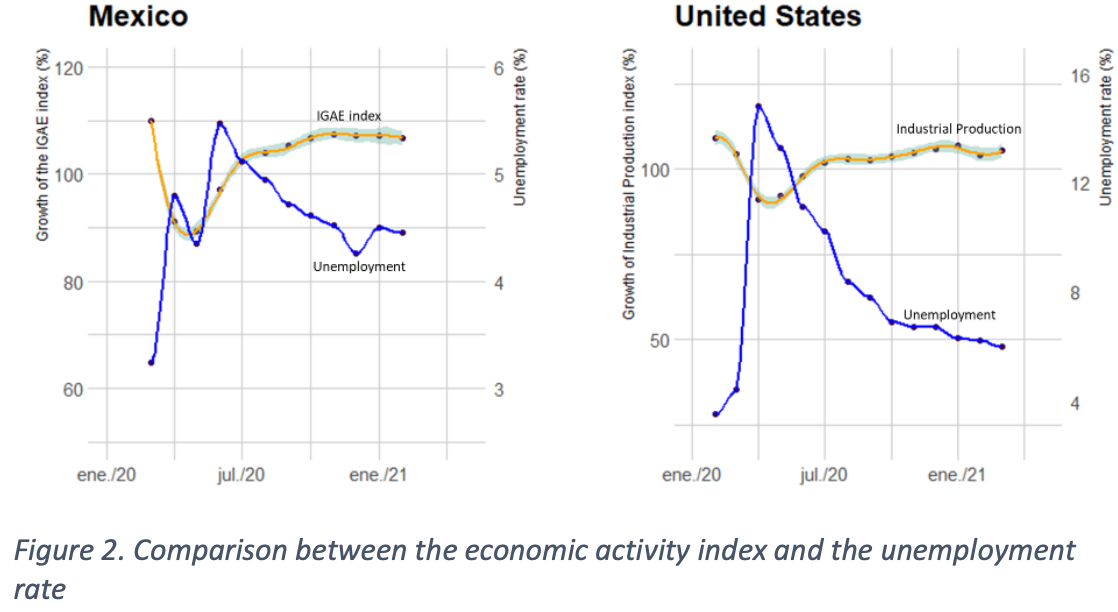
Another economic repercussion attributable to the measures to contain COVID-19 was the increase in the unemployment rate. In Mexico, it went from 3.6% in February 2020 to 5.5% four months later, while in the US went from 3.5% in February 2020 to 14.8% in April of the same year. After these dives, employment in both countries recovered, although the recovery was faster in the US. However, none have reached pre-epidemic levels. Since the impact on unemployment seems broader in the US, it is important to mention a potential underreporting in Mexico caused by a large proportion of the population working in the informal sector.
- Conclusion
As the results show, both government’s responses to contain the pandemic caused mobility to reduce, economic activity to reduce, and unemployment to increase. As these measures were relaxed, mobility and economic activity slowly started to increase again, while unemployment levels started to drop over time.
2. Updates on Research Problem #2: PPE
Contributing Milestone 4: Risk Bulletin {#sec:ML4RiskBulletin}
(Figure 5) 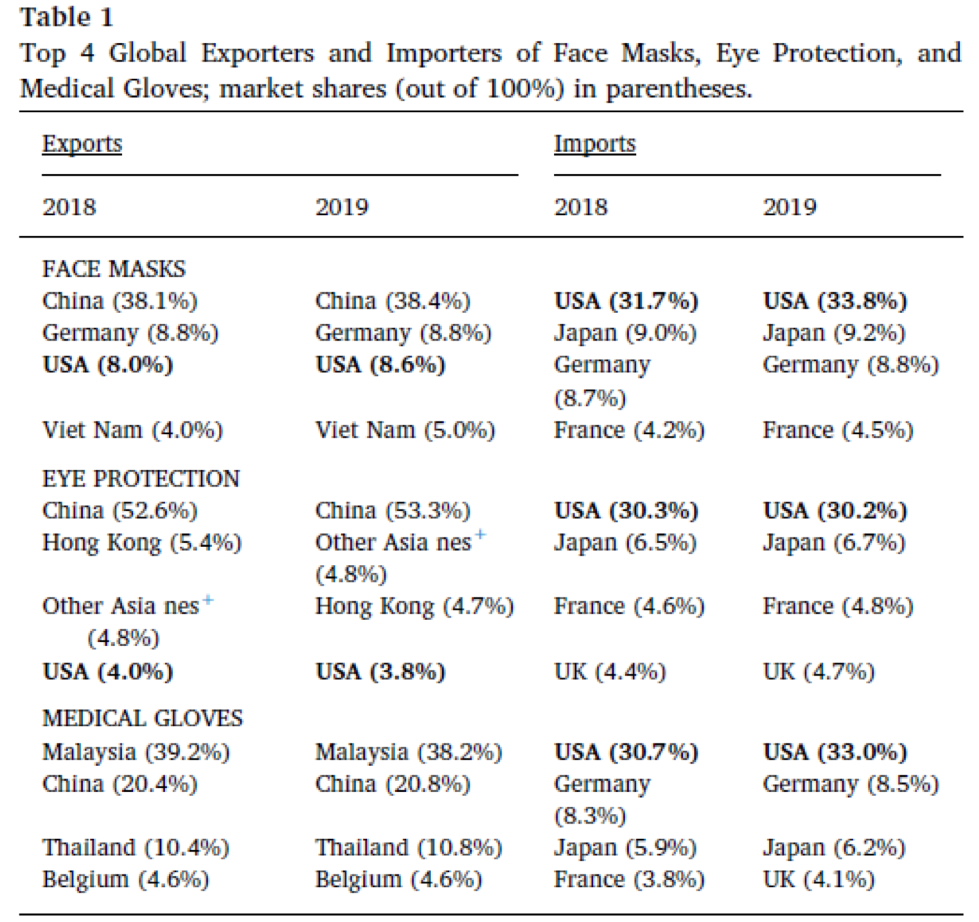
-
Findings
-
China is the world’s largest exporter of medical face masks and eye protection (Cohen & Meulen Rodgers, 2020).
-
US is by far the largest importer of face masks, eye equipment, and medical gloves in the world market (Cohen & Meulen Rodgers, 2020).
-
The COVID-19 outbreak in China in late 2019 led to a surge in demand within China for PPE, especially for disposable surgical masks (Cohen & Meulen Rodgers, 2020).
-
As a result, China’s government not only restricted its PPE exports, it also purchased a substantial portion of the global supply (Burki, 2020).
-
On June 3rd, 2020 the Wall Street Journal reported that Chinese electric-car maker “BYD” built what it claimed was the world’s largest mask factory, now capable of producing 50 million masks a day.
-
Within a few weeks, “BYD” signed more than a billion dollars worth of contracts for medical goods including N95 masks. Those deals were signed before BYD had obtained U.S. federal certification for N95 masks (The Wall Street Journal, 2020).
-
In other article from June 9th, 2020, the Wall Street Journal reported that “BYD” got U.S. approval to supply N95 masks to US states such as California (1 billion masks deal) and Washington.
-
Conclusions
In order to reduce the dependency on foreign PPE supply, (Cohen & Meulen Rodgers, 2020) recommends to consider a national industrial policy “to incentivize PPE production using existing technology while encouraging development, testing, and production of higher-quality, reusable PPE.
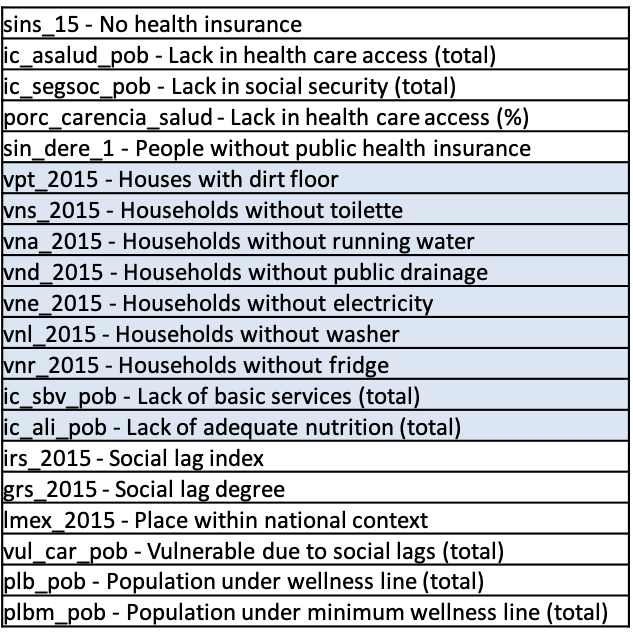
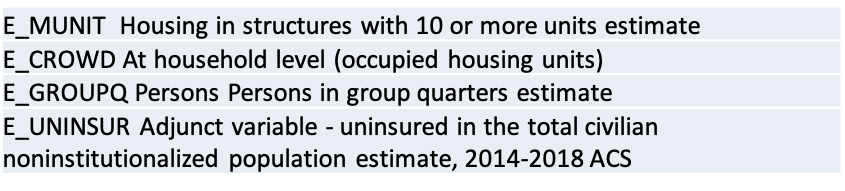
R13 DLS-RDM Matrix Variables on the BN Model
Contributing to Milestone 3: Data Lake {#sec:ML3DataLake}
Variables in use come from these indices: – A. CDC’s Social Vulnerability Index (SVI) – B. CENSUS’ Community Resilience Estimates(CRE) – C. Mexico’s COVID19 Social Vulnerability Index (MCSVI) – D. Mexico’s Heuristic COVID-19 Risk Index (MCRI)
- The variables in the model from each of the four above are reviewed
- Determining which have been utilized and which ares still to be included
- CDC SVI and CRE variables not included, listed in (Fig. 6)

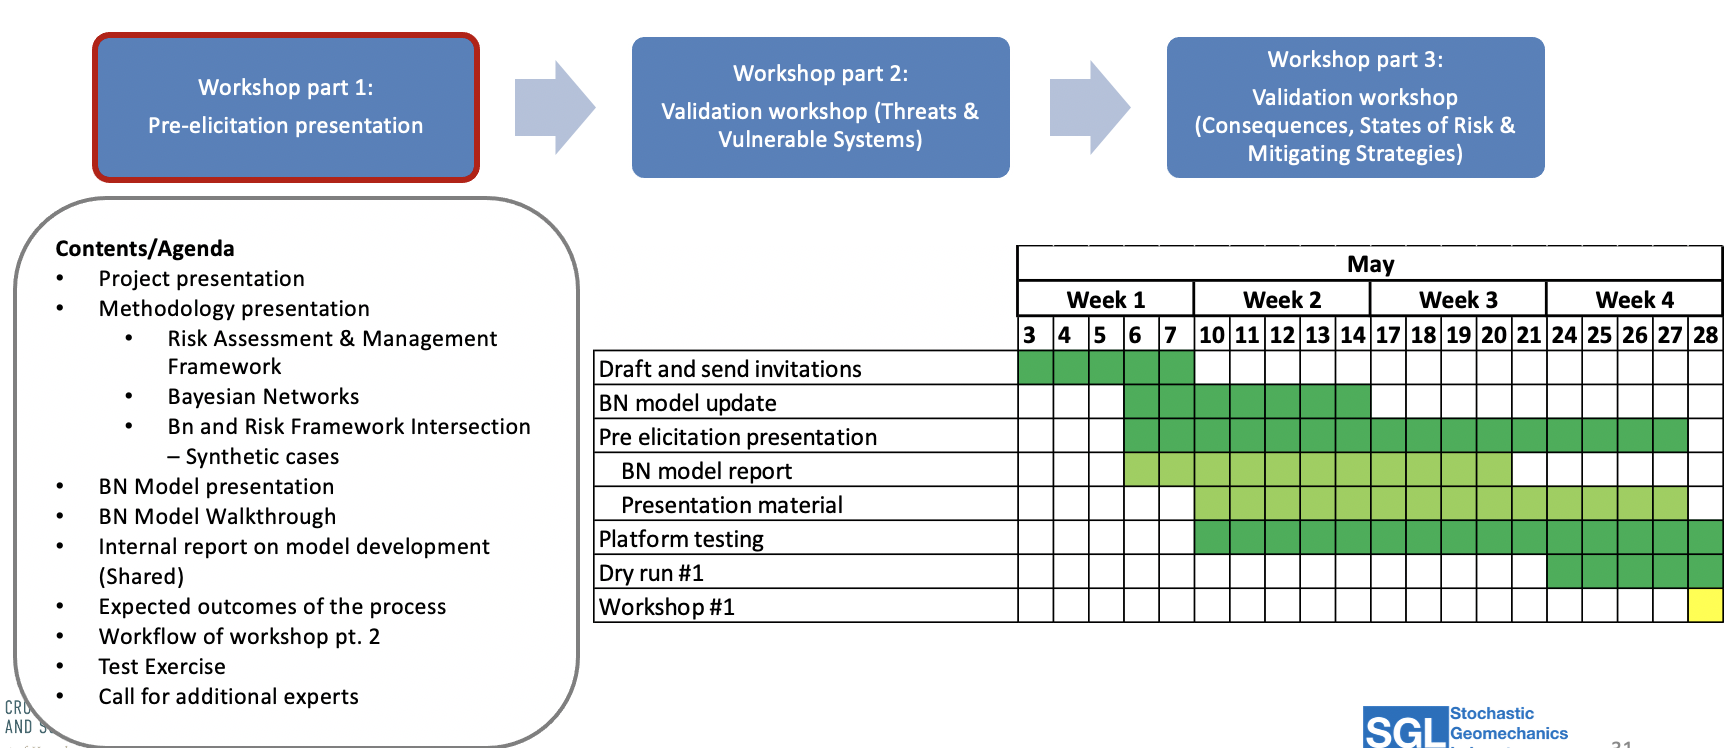
BN Model Validation process
- The process of validation and presentation of the models was established. It is exemplified by charts (Fig. 8), (Fig. 9), (Fig. 10) and (Fig. 11).
Communication Platform to Restore and Create Supply Chains – Third Objective
- Introduction
In this section, we will be discussing the progress of our communication platform to restore and create supply chains within the U.S. and Mexico.
- Objectives
- Create a web-based system with binational manufacturers, suppliers and purchasers information
- Incorporate a social component for interactivity between users to foster new collaborations, and strengthen supply chains
- Build an initial website prototype connected to database
- Methodology
- Identify public data sources of evidence from Data Lake research problems
- Categorize into risk-based methodology components
- Review available virtual social interaction platforms weaknesses and advantages
- Identify features and tools to use in our own project
- Standardize database format
- Case Studies
- Review of similar available Platforms:
- Overwhelming majority are Database front-ends
- Few tools have connection functionality beyond database
- How this can be used in our project:
- Collect and standardize a database of our own
- Utilize the datasets already available
- Build front-end interface to query data
- Must be able to display/query data, as well as update database
- Add new users as registration occurs
- Garner more business and supply chain data upon registration
- Build out more functionality from there
- Social aspect, connecting suppliers and buyers
- Collect and standardize a database of our own
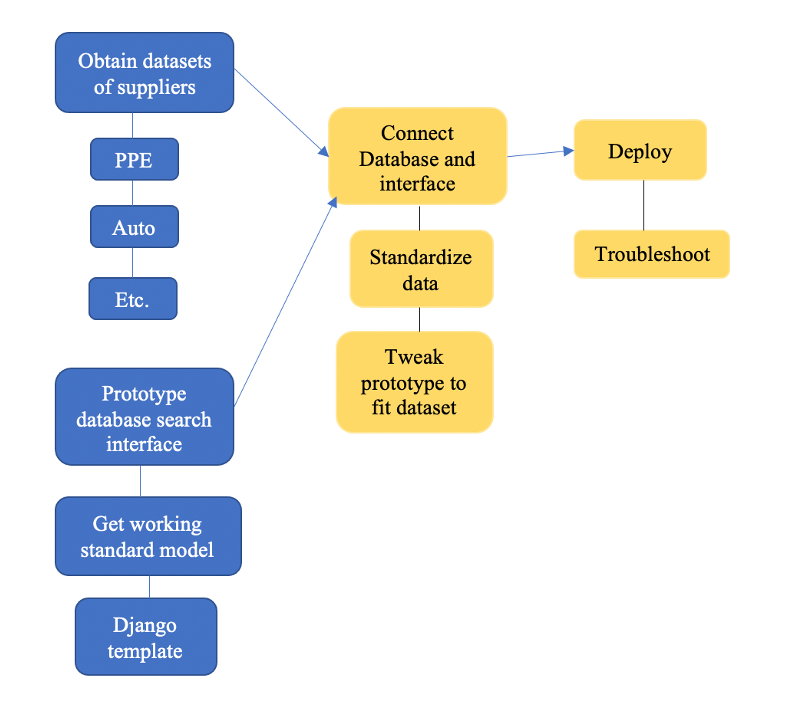
Rough workflow of platform creation in (Fig. 12)
A review of the studied tools available to develop the platform is shown in (Fig. 13) – Green denotes favorable attributes, yellow is moderate, and red is unfavorable
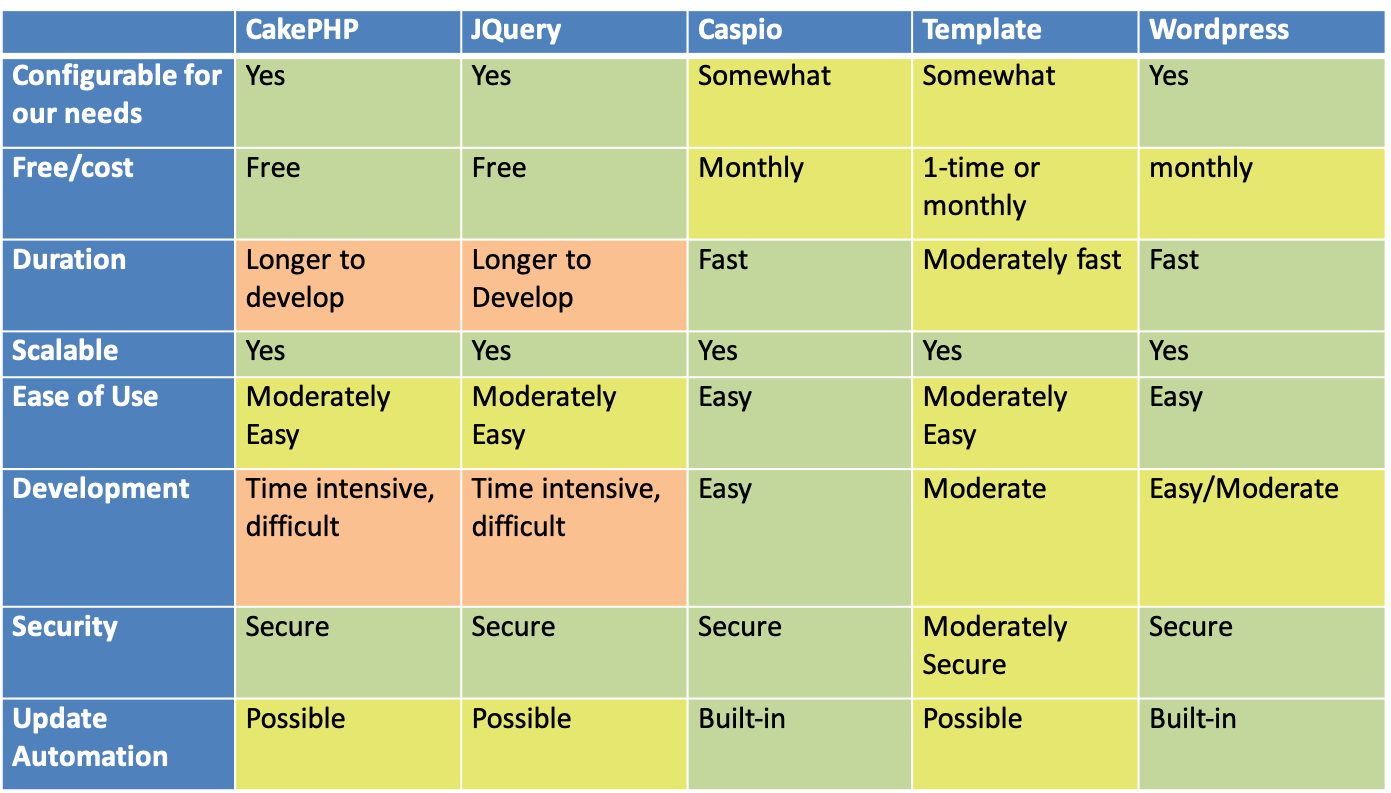
- Results
- The most favorable tool was decided to be WordPress
- Positive attributes:
- Scalable, secure
- Ease of use
- Requires more configuration and setup than caspio, but the second least overall
- Pre-made themes and designs
- Plugins to solve most needs
- ~$25/month
- Questions:
- Can it handle the functionality we want to implement?
- Is it configurable enough to fulfill our needs?
- Positive attributes:
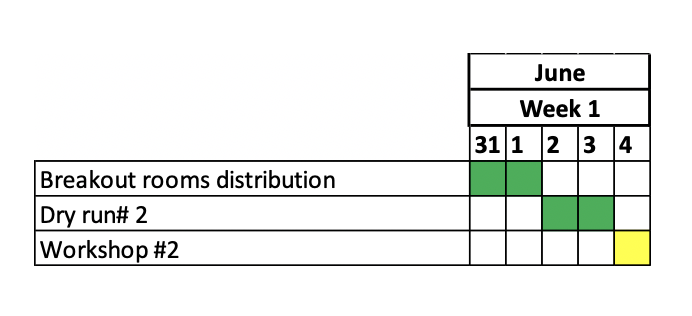
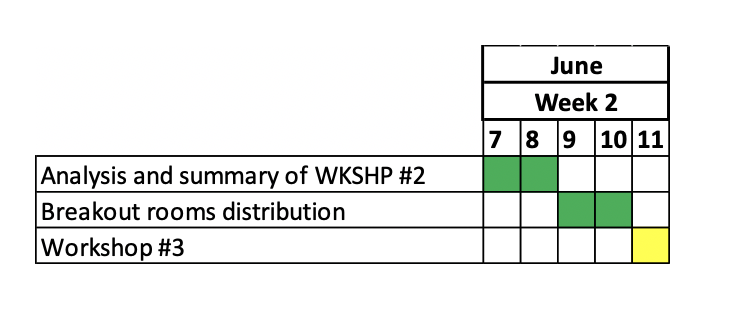
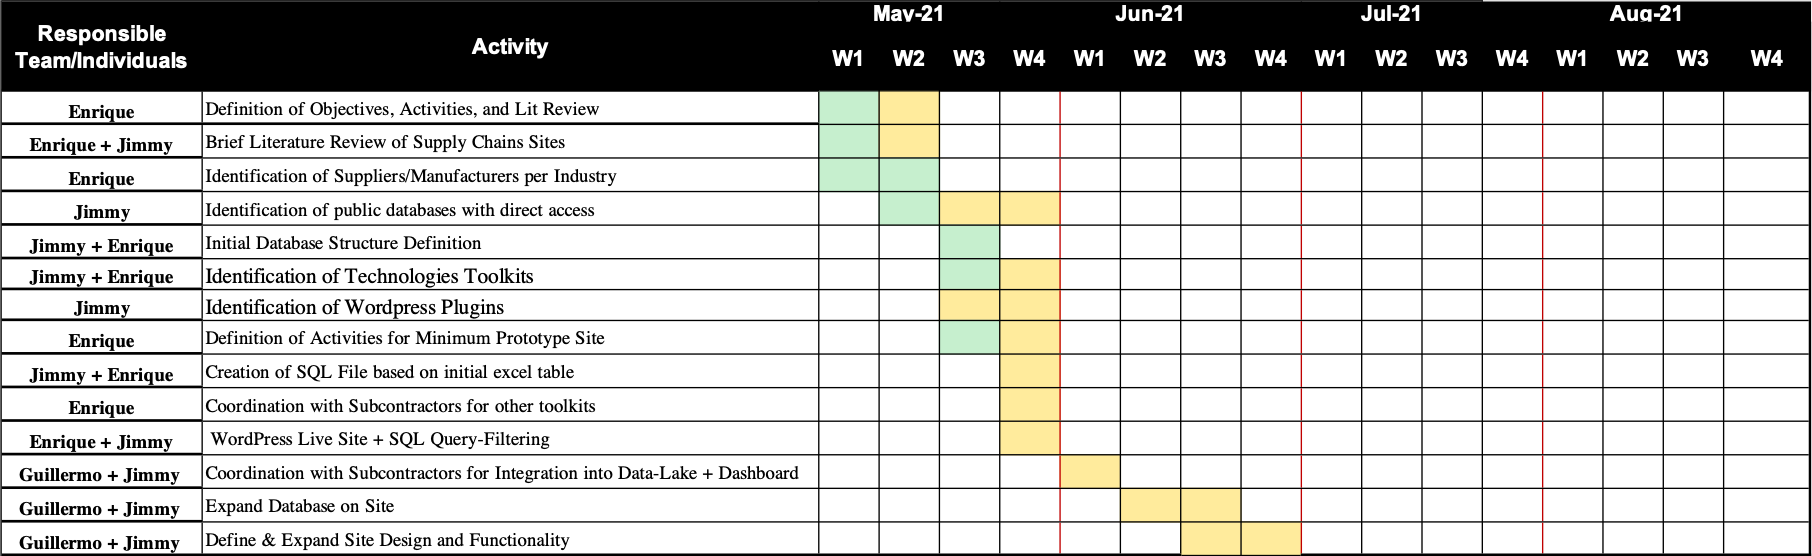
Timeline of the workflow and objectives for this project are shown in (Fig. 14)
- Conclusions
Action Items moving forward:
- Work on minimum prototype based on WordPress
- Show objectives and general plans to Data Lake Team
- Provide example SQL file to Minerva to ingest into Data-Lake
- Get feedback from them to guide our development
- Question: Is there a better product for this use-case?
- Identify Plugins and tools to help develop
- Ask the Data Lake Team their experiences with this type of website
References
(misc){CohenRogers, author = {Cohen, Jennifer and van der Meulen Rodgers, Yana}, title = {Contributing factors to personal protective equipment shortages during the COVID-19 pandemic}, journal = {Preventive Medicine}, pages = {106263}, ISSN = {0091-7435}, year = {2020}, type = {Journal Article} }
(misc){Burki2020, author = {Burki, Talha}, title = {Global shortage of personal protective equipment}, DOI = {10.1016/S1473-3099(20)30501-6}, url = {https://www.ncbi.nlm.nih.gov/pmc/articles/PMC7314445/}, year = {2020}, type = {Journal Article} }