
R-13 Risk Bulletin – June 2021
June 14, 2021
R13 Monthly Research Brief: June
Objective
The objective of the Monthly Risk-Bulletin is to provide an overview a) of lessons learned during the past month in the project, b) of a score-card-type system to communicate the state of risk of supply chains impacted by COVID-19 supporting health infrastructure and the workforce between the U.S. and Mexico, and c) of a communication system to facilitate the restoration of broken supply chains and the formation of new ones to reactivate trade between U.S. and Mexico. The report aims to offer valuable insights to the general public and decision-makers towards informed preventive actions to reduce the current pandemic’s potential impact on critical supply chains and better strategize about feasible social, economic, and environmental risk-mitigating actions against COVID19 and converging threats. This bulletin is jointly produced by the project’s PIs, the project’s contractors, and the U.S. binational task force serving as advisors to the project.
| Project PIs | |
|---|---|
| Zenon Medina-Cetina, PhD – PI | Gregory Pompelli, PhD – Co-PI |
| Matt Cochran, DVM, MIA – Co-PI | Maria Jose Perez-Patron, PhD – Co-PI |
| Miriam Olivares, GISP – Co-PI |
| Document prepared with the support of: | Reviewed & Approved by: |
| Enrique Z. Losoya, Guillermo Duran, Juan Pablo Alvarado, Barnett Jimmy | Dr. Medina-Cetina – PI |
| PhD Students SGL – Research Assistants | Date: 05/14/2021 |
Suggested citation:
Medina Cetina, Z., Pompelli, Gregory., Cochran, Matt., Olivares, Miriam., Perez-Patron, Maria J., Duran, Guillermo., Alvarado, Juan Pablo., Z-Losoya, Enrique., & Lopez-Acosta, Araceli. (2021). CBTS-SGL Monthly Risk Bulletin: June. https://r13-cbts-sgl.engr.tamu.edu/
@misc{Medina2021,
   author = {Medina Cetina, Z. and Pompelli, Gregory and Cochran, Matt and Olivates, Miriam, Perez-Patron, Maria J. and Duran, Guillermo and Alvarado, Juan Pablo and Alexi, Allen, and Torres, Cesar, and Barnett, Jimmy, and Lopez-Acosta, Araceli, and Sanchez-Siordia, Oscar, and Rojas, Minerva and Zarate-Losoya, Enrique},
   title = {*CBTS-SGL Monthly Risk Bulletin: June.*},
   url={https://r13-cbts-sgl.engr.tamu.edu/},
   year={2021},
   month={June}
}
R-13 Risk Bulletin – June 2021
Introduction
This month included many important milestones for the taskforce. Model validation workshops continued and were conducted with experts from many industries and disciplines, and work continues to be done on the development of the dashboards, platforms and indices associated with our project. The feedback was taken into account and used to tweak our models to best represent reality.
II. Risk Communication Mechanism
R7 Model Validation Workshops
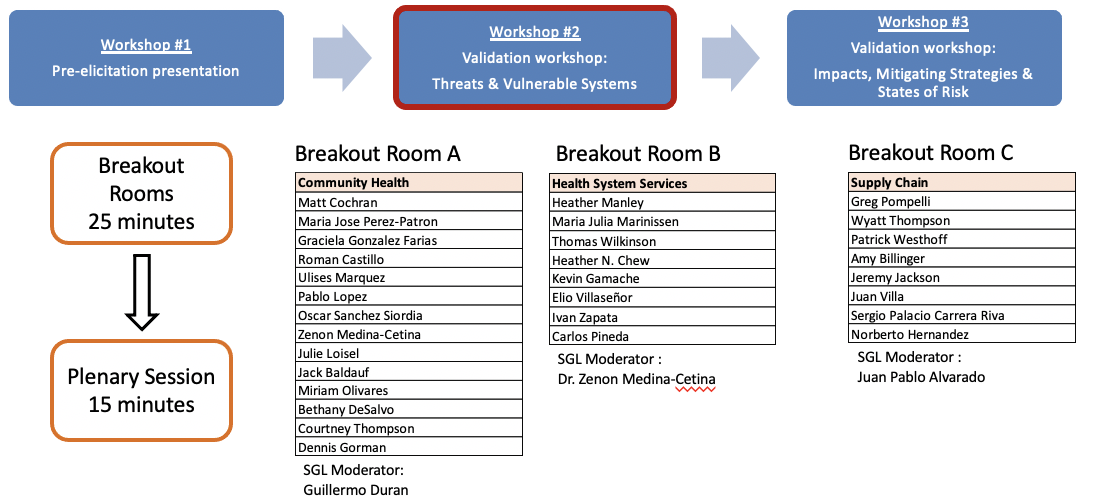
Workshop #2 – June 4, 2021
The experts were shown the models and variables included, as well as the categorization of each variable into the primary variable categories:
- Threats (Workshop 2)
- Vulnerable Systems (Workshop 2)
- Impacts (Workshop 3)
- States of Risk (Workshop 3)
- Mitigating Strategies (Workshop 3)
The materials presented in Workshop 1 helped inform the feedback collected in this workshop, and each of the 28 experts were given a questionnaire about the variables included and outside variables which would be beneficial to the model.
The 3 step validation process, separated into workshops, is detailed in (Fig. 1)
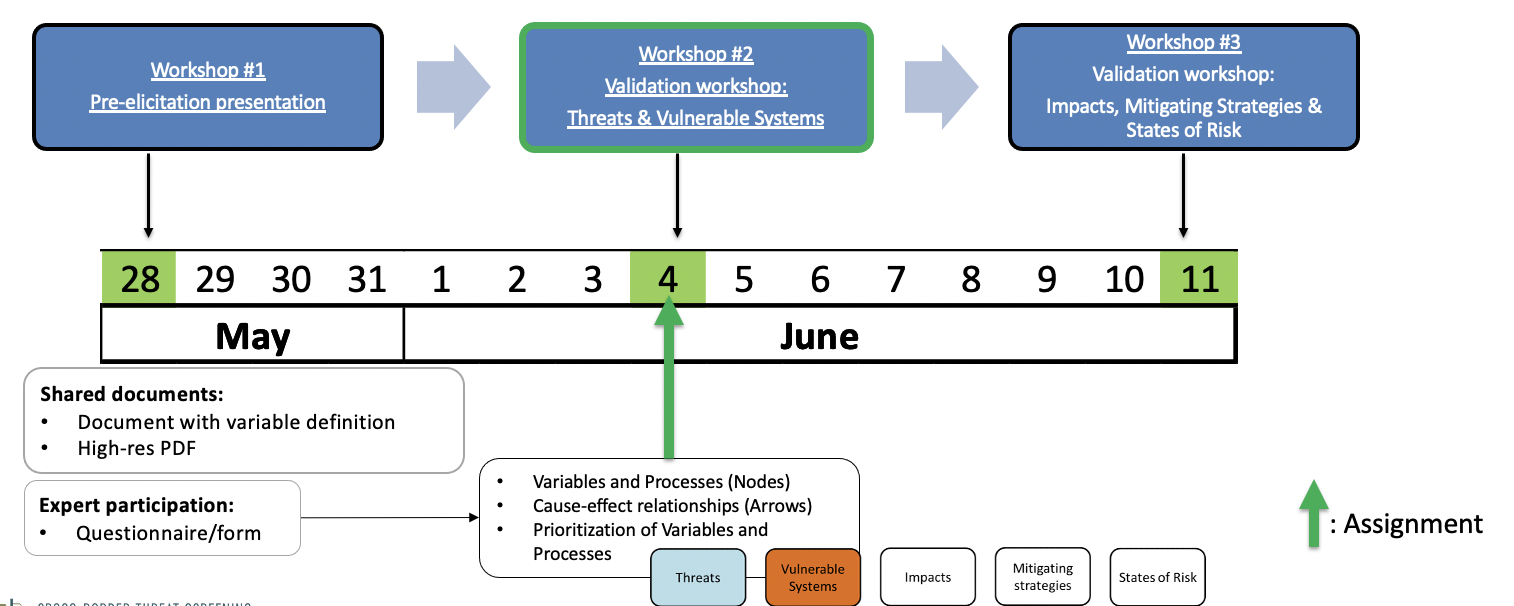
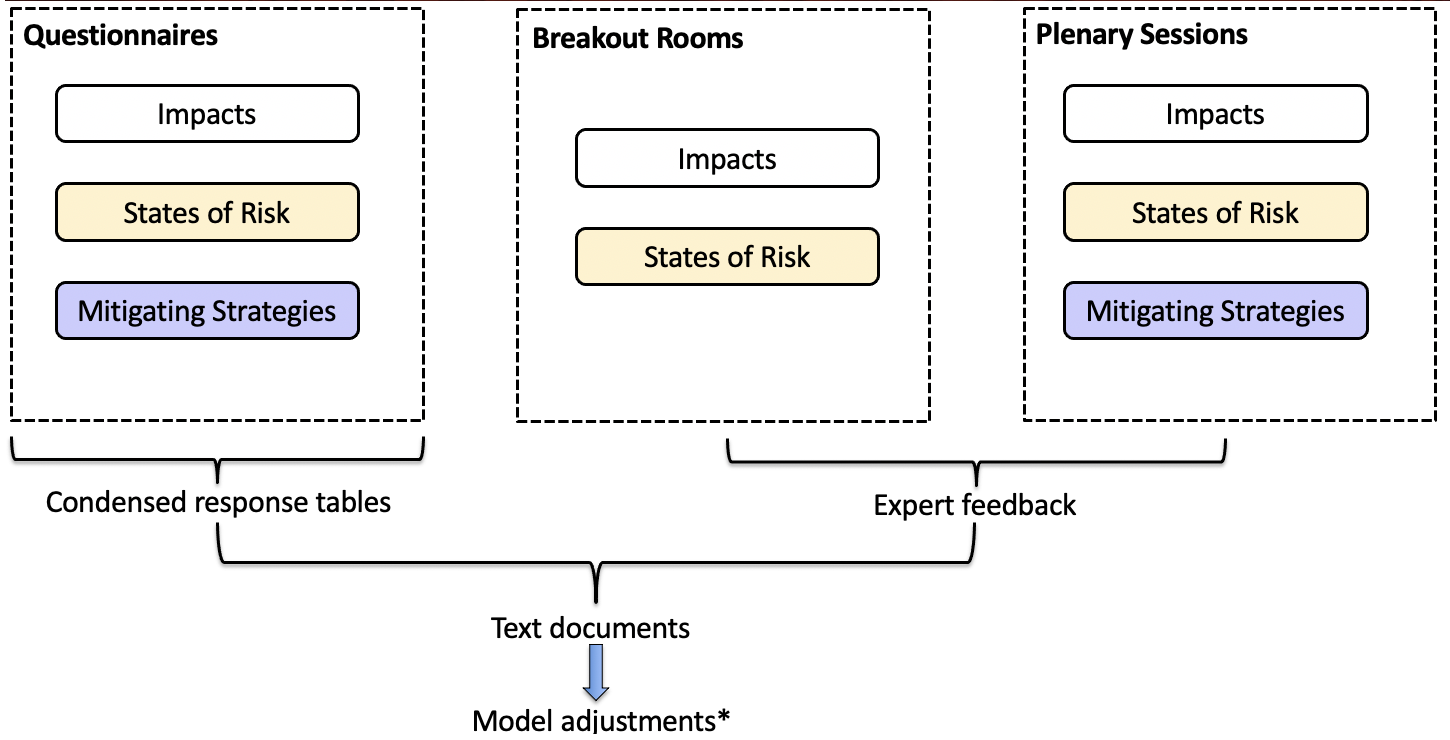
The structure of workshop 2 consisted of breakout rooms to discuss the results of the survey followed by an overall plenary session to discuss the information on the model to the experts. Finally there is a call to action asking each expert to answer a questionnaire about impacts and states of risk for the upcoming validation workshop 3.
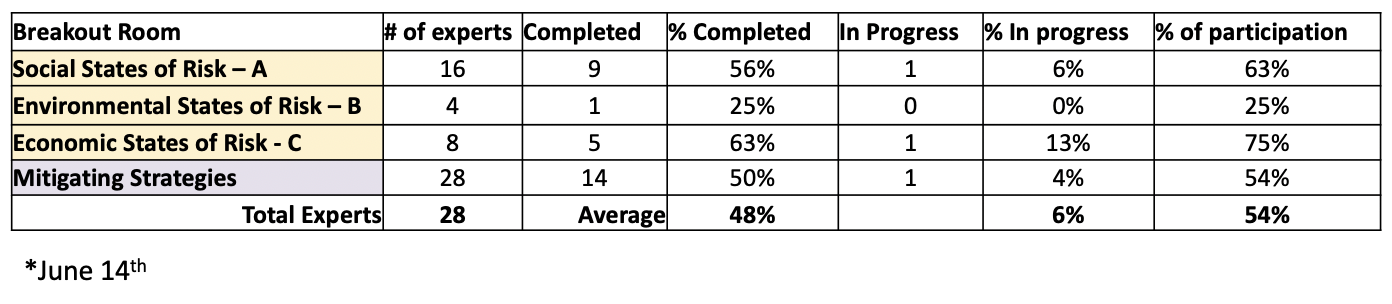
Each breakout room in the workshop had a specific topic, in which each expert was divided into a topic they specialized or had knowledge in. They were asked to complete a questionnaire specific to their topic of study. (Fig. 2 )
displays the response rates of each survey by topic.
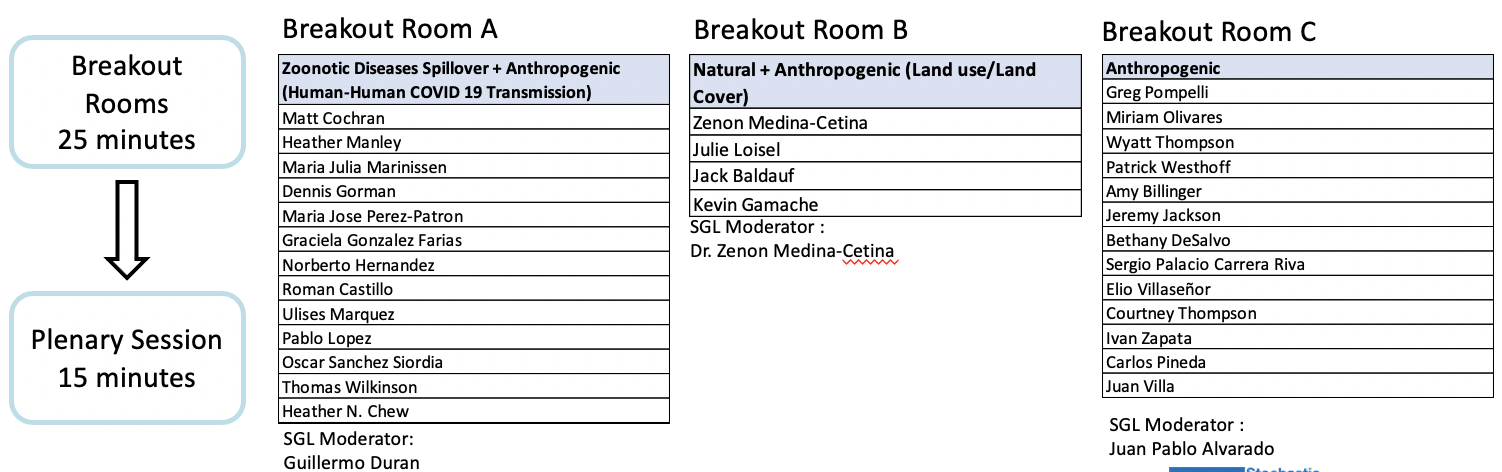
The experts making up each breakout room, in the Threats category, are displayed in (Fig. 3)
The overarching discussion questions for each model in each topic, generally consisted of the following:
- Would you suggest adding more variables to the model?
- If yes, which ones and why?
- Would you suggest removing any variables?
- If yes, which ones and why?
- Would you suggest merging any variables?
- If yes, which ones and why?
- Would you suggest adding any cause-effect relationships?
- If yes, which ones and why?
- Would you suggest removing any cause-effect relationships?
- If yes, which ones and why?
- Would you suggest inverting any cause-effect relationships
- If yes, which ones and why?
- Have we successfully captured variables and processes in this group (or topic)?
The experts making up each breakout room, divided by topic, in the Systems category are below in (Fig. 4)
Finally, the breakout room assignments were confirmed for workshop 3, and questionaires sent out to each participant (Fig. 5)
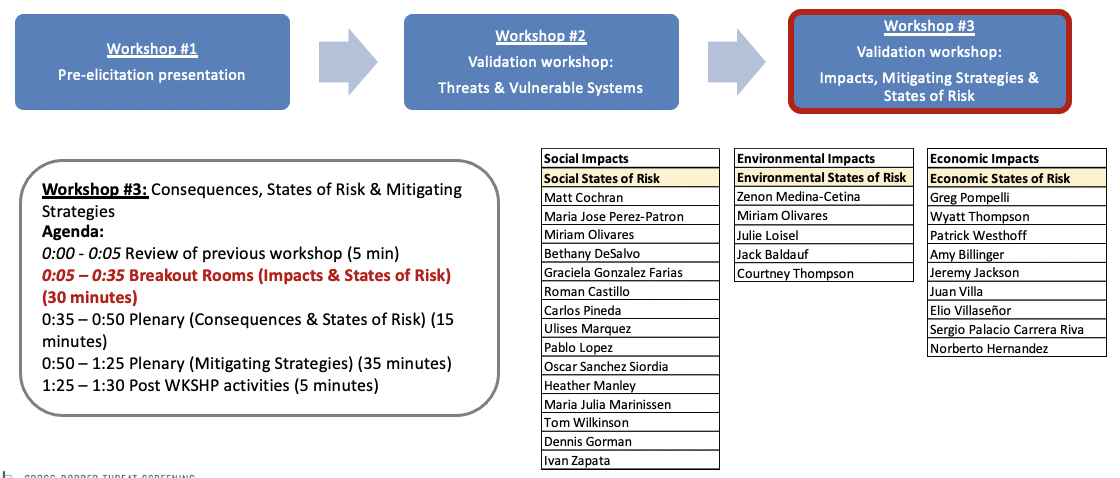
Workshop #3 – June 11, 2021
The third workshop followed the same structure and process as workshop 2, with a focus on Impacts, States of Risk and Mitigating strategies.
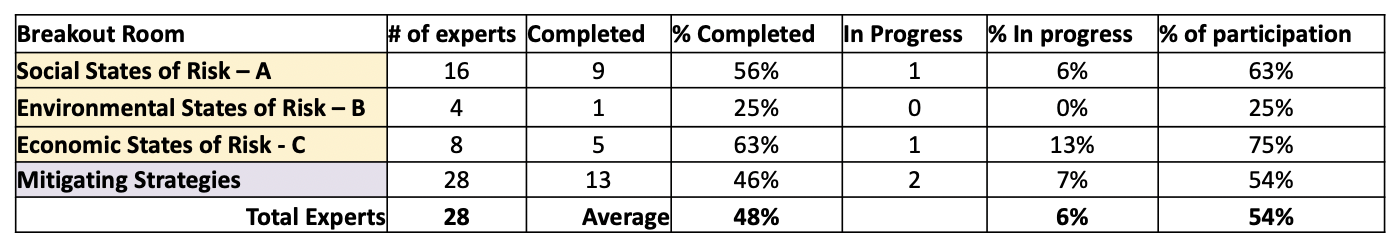
(Fig. 6) displays the response rates of each survey by topic.
The experts making up each breakout room, divided by topic, in the Impacts category are below in (Fig. 7)
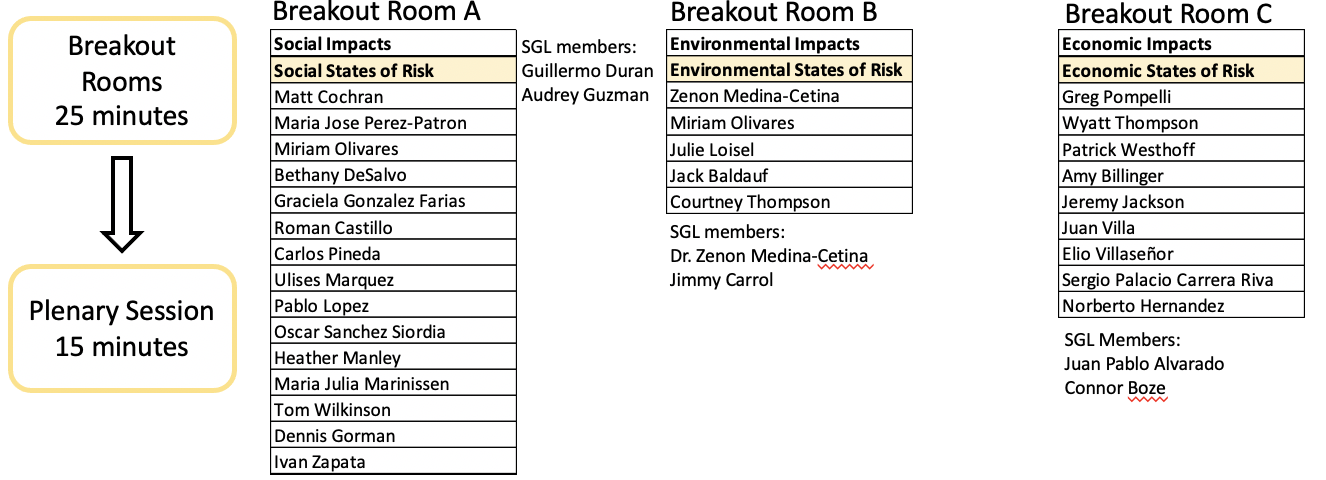
In the same way as Workshop 2, the overarching discussion questions for each model in each topic, generally consisted of the following:
- Would you suggest adding/removing/merging more variables to the model?
- If yes, which ones and why?
- Would you suggest adding/removing/inverting any cause-effect relationships?
- If yes, which ones and why?
- Have we successfully captured variables and processes in this group (or topic)?
Finally, each expert was asked to complete a final survey and interview assessing the validation process and the sources of evidence. – This information is used to fine-tune the model and bring more eyes on the project to help better represent and predict risks.
Model Validation Workshop Review
The model validation process, taking into account expert feedback is displayed in (Fig. 8)
Risk Assessment and Management Bayesian Network including the proposed mitigating strategies (06-21-2021)
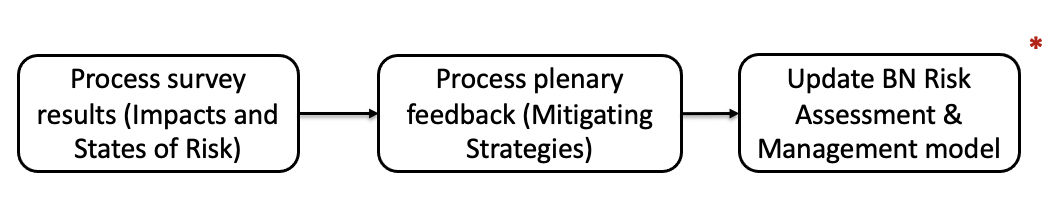
Process to review and implement expert feedback (Fig. 9)
Risk Communication Platform Design
For the Risk Communication Platform, a product to facilitate communication between businesses needs to be created. A rough outline of the project was determined this week.
Platform necessities:
- Private Messaging
- Search Feature, criteria and tags
- Unique user/business profiles and networking features
- Social Posts or messaging
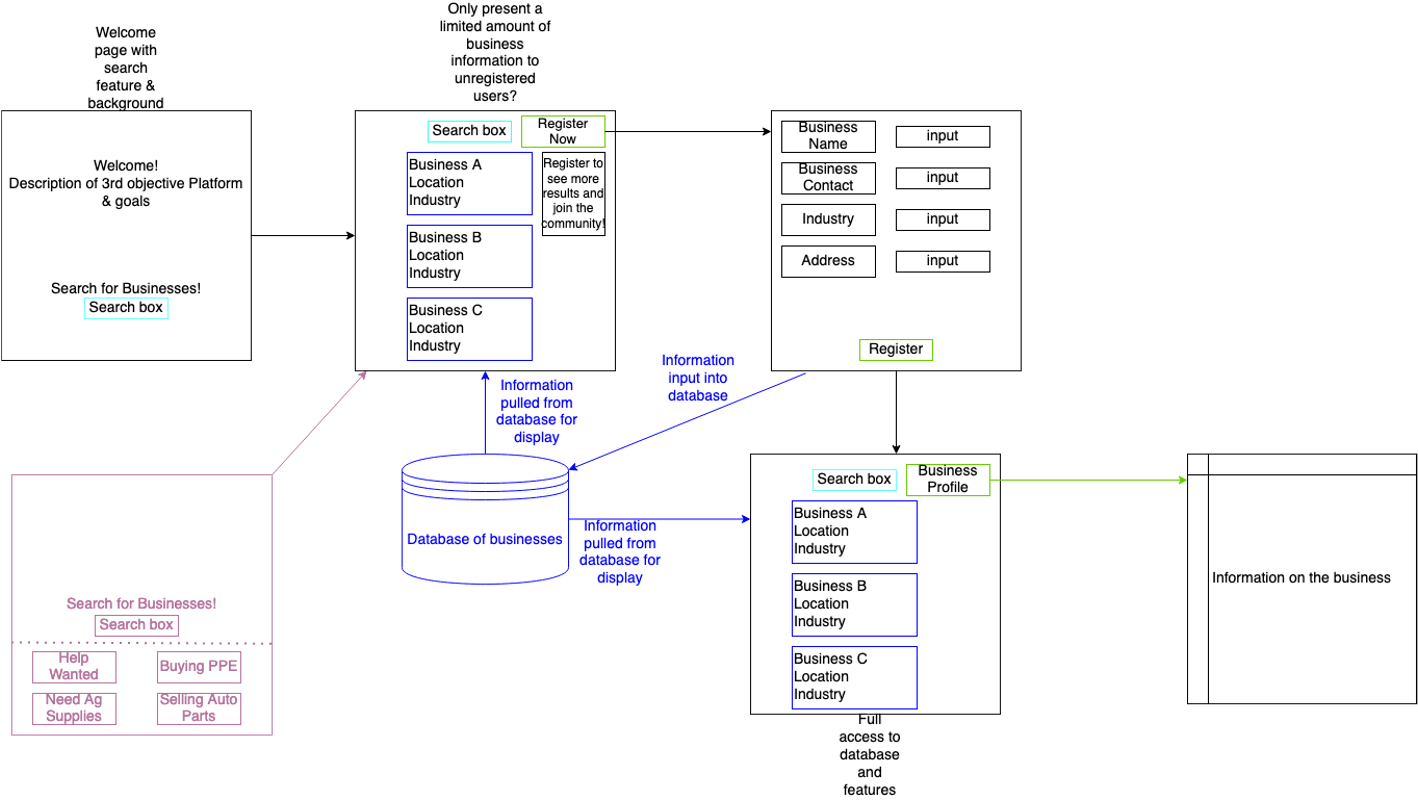
Platform Technical Conceptual Model (Fig. 10)
:
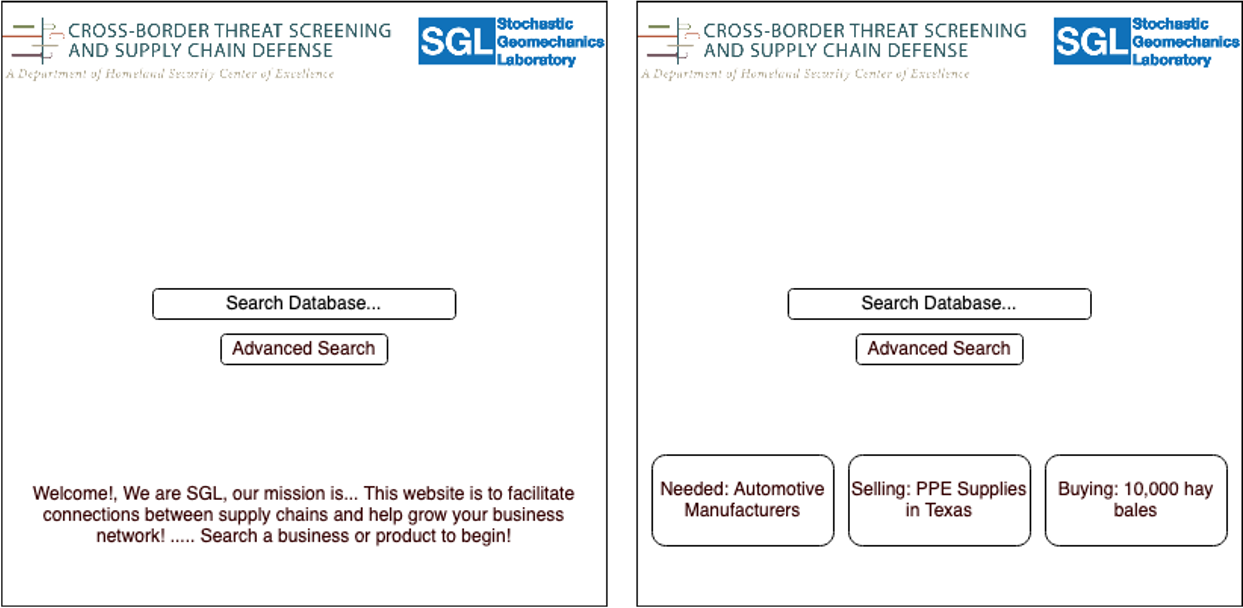
- For the welcome page, 2 conceptual models were drafted (Fig. 11)
It should Contain:
- Logo
- Search Feature
- Two Options:
- Can contain our social posts, advertise them directly to front page
- Can just display mission statement or information for use of website
- For the main page, the database display page, a few features should be included:
- Must display database data
- Registration Feature
- When clicked, each business “card” will link to the business profile containing more information about each business
- Some websites give a preview, but restrict total database access until after registration
- Can possibly contain social posts (advertisement section), similar to sites like Govshop
- Registration Page
- Allow businesses to create personalized profile
- Contains information about industry, products, and business partners/suppliers
- Information to register:
- Which products are they lacking?
- What are they looking to sell?
- Location – can create maps (secondary objective)
- Have additional data input in the business profile page
- For final page, the business profile page, it will be a display of the personalized data from each business
- Here, site users will find all the information necessary to locate items they need and reach out to the business
Tools necessary for development:
- Search & Go Plugin used for database querying
- Search feature, display properties, etc
- Home page and Database Display Page
- Formidable Forms Plugin used for Registration forms, business profiles and database updating
- Registration page, business profile page, database display page
- Can also handle the social posts or ”needs” section
R13 Dashboard Updates {#sec: DashUpdate}
Data Journey from Data Request to R-13 Dashboard {#sec: DataJourney}
Introduction
Graphic of the Data Journey (Fig. 12)

- Data Petition
- THEI Contractors or R13 members are asked to collect or obtain data
- Data Discovery:
-
THEI or R-13 member searches data, and provides the data & data-dictionary in the Data Discovery folder at MS Teams – R13 Data-Lake Channel.
- If data acquisition requires an inquiry or request to the data source:
- THEI or R-13 member drafts the inquiry.
- SGL or CBTS leadership sends the request.
- Approve/Reject Dataset:
- THEI or R-13 member discusses with SGL, and a slide is prepared to present during the Data-Lake meeting.
- Data-Lake attendees approve or reject proposed data.
- Pre-processing Data Stage:
- If not approved, THEI or R-13 member continues looking for data sources.
- If approved, SGL:
- Enters the variables in R-13 DLS-RDM and assigns a VAR number.
- Moves data from Data Discovery to Risk Matrix folder.
- Asks Plenum to process and ingest the data in the Data-Lake.
- Processing Data Stage:
- SGL classifies variables from the dataset in terms of Risk in R-13 DLS-RDM.
- Plenum assigns “table names” to the dataset CSVs.
- THEI fills required metadata fields for each variable in R-13 DLS-RDM: Variable Short Name, Variable Description, Spatial Granularity, Temporal Granularity, and Dashboard Fields – Table Name.
- Publication of Data in R-13 Dashboard:
- CentroGeo and Plenum coordinate to publish new data in the R-13 Dashboard (current approach).
- New data is published in R-13 Dashboard as soon as required metadata fields are completed (upcoming approach).