

R-13 Risk Bulletin – February 2021
Monthly Risk-Bulletin: February 2021
Last revised: March 03, 2021
Objective
The objective of the Monthly Risk-Bulletin is to provide an overview a) of lessons learned during the past month in the project, b) of a score-card-type system to communicate the state of risk of supply chains impacted by COVID-19 supporting health infrastructure and the workforce between the U.S. and Mexico, and c) of a communication system to facilitate the restoration of broken supply chains and the formation of new ones to reactivate trade between U.S. and Mexico. The report aims to offer valuable insights to the general public and decision-makers towards informed preventive actions to reduce the current pandemic’s potential impact on critical supply chains and better strategize about feasible social, economic, and environmental risk-mitigating actions against COVID19 and converging threats. This bulletin is jointly produced by the project’s PIs, the project’s contractors, and the U.S. binational task force serving as advisors to the project.
| Project PIs | |
|---|---|
| Zenon Medina-Cetina, PhD – PI | Gregory Pompelli, PhD – Co-PI |
| Matt Cochran, DVM, MIA – Co-PI | Maria Jose Perez-Patron, PhD – Co-PI |
| Miriam Olivares, GISP – Co-PI |
| Document prepared with the support of: | Reviewed & Approved by: |
| Enrique Z. Losoya, Guillermo Duran, Juan Pablo Alvarado, Barnett Jimmy | Dr. Medina-Cetina – PI |
| PhD Students SGL – Research Assistants | Date: 05/14/2021 |
Suggested citation:
Medina Cetina, Z., Pompelli, Gregory., Cochran, Matt., Olivares, Miriam., Perez-Patron, Maria J., Duran, Guillermo., Alvarado, Juan Pablo., Z-Losoya, Enrique., & Lopez-Acosta, Araceli. (2021). CBTS-SGL Monthly Risk Bulletin: February. https://r13-cbts-sgl.engr.tamu.edu/
@misc{Medina2021,
   author = {Medina Cetina, Z. and Pompelli, Gregory and Cochran, Matt and Olivates, Miriam, Perez-Patron, Maria J. and Duran, Guillermo and Alvarado, Juan Pablo and Alexi, Allen, and Torres, Cesar, and Barnett, Jimmy, and Lopez-Acosta, Araceli, and Sanchez-Siordia, Oscar, and Rojas, Minerva and Zarate-Losoya, Enrique},
   title = {*CBTS-SGL Monthly Risk Bulletin: February.*},
   url={https://r13-cbts-sgl.engr.tamu.edu/},
   year={2021},
   month={February}
}
Table of Contents
R-13 Risk Bulletin – February 2021
- Objective
- Introduction
- I. Project Status & Lessons Learned
- Milestone 3: Data-Lake
- Milestone 4: Risk-Bulletin
- U.S. Vaccination Overview and Supply Chain
- Moderna’s Manufacturing Facilities and Supply Chain Overview
- COVID-19 Vaccination Landscape
-
- Risk Communication Mechanism
- Restoration and Creation of Supply Chains
- References
Introduction
The objective of the Monthly Risk-Bulletin is to provide an overview a) of lessons learned during the past month in the project, b) of a score-card-type system to communicate the state of risk of supply chains impacted by COVID-19 supporting health infrastructure and the workforce between the U.S. and Mexico, and c) of a communication system to facilitate the restoration of broken supply chains and the formation of new ones to reactivate trade between U.S. and Mexico. The report aims to offer valuable insights to the general public and decision-makers towards informed preventive actions to reduce the current pandemic’s potential impact on critical supply chains and better strategize about feasible social, economic, and environmental risk-mitigating actions against COVID19 and converging threats. This bulletin is jointly produced by the project’s PIs, the project’s contractors, and the U.S. binational task force serving as advisors to the project.
- Integrate a triple-helix binational taskforce comprised of representatives from academia, industry, and government from the U.S. and Mexico. Address the public health impacts of the COVID-19 pandemic on the U.S. – Mexico health supply chain systems for health infrastructure and for the health of the workforce, considering current and emerging regional social, economic, and environmental Risks.
- Develop a Data-Lake System concentrating near real-time analytics following a risk systems approach that can provide strategic information about the evolution of COVID19 and related current and emerging threats, the state of vulnerability of the health supply chain systems and the likely impacts a combination of these may cause to society, the economy and the environment.
- Publish a monthly U.S.-Mexico COVID-19 Risk Bulletin to provide scientific, technological, and strategic cultural support to secure the operation of the U.S.-Mexico health supply chain systems.
The Data-Lake System will provide access to risk-based analytics and its sources, including datasets, predictive models, and experts’ opinions, needed to produce evidence-based support on the causes and effects posed by COVID-19 on the U.S. health supply chain. While some of these exist already, a technological harmonization will be required to add it into the Data-Lake System, and other analytics will need to be produced. Additionally, the identification and characterization of evidence depicting the dynamics of infrastructure interactions of U.S. domestic and international health supply chains, from procurement, manufacturing, warehousing, to transportation processes, will serve as the basis for the Data-Lake System platform, where available and emerging sources of evidence will be arranged following a common risk framework.
I. Project Status & Lessons Learned
Milestone 3: Data-Lake
- The development version of the dashboard has been implemented, developed and is operational on AWS using information from the Data-Lake server
- Version 1 of the dashboard is mostly reporting information from the official Mexico’s COVID-19 dashboard, however, no exposure information is availble yet.
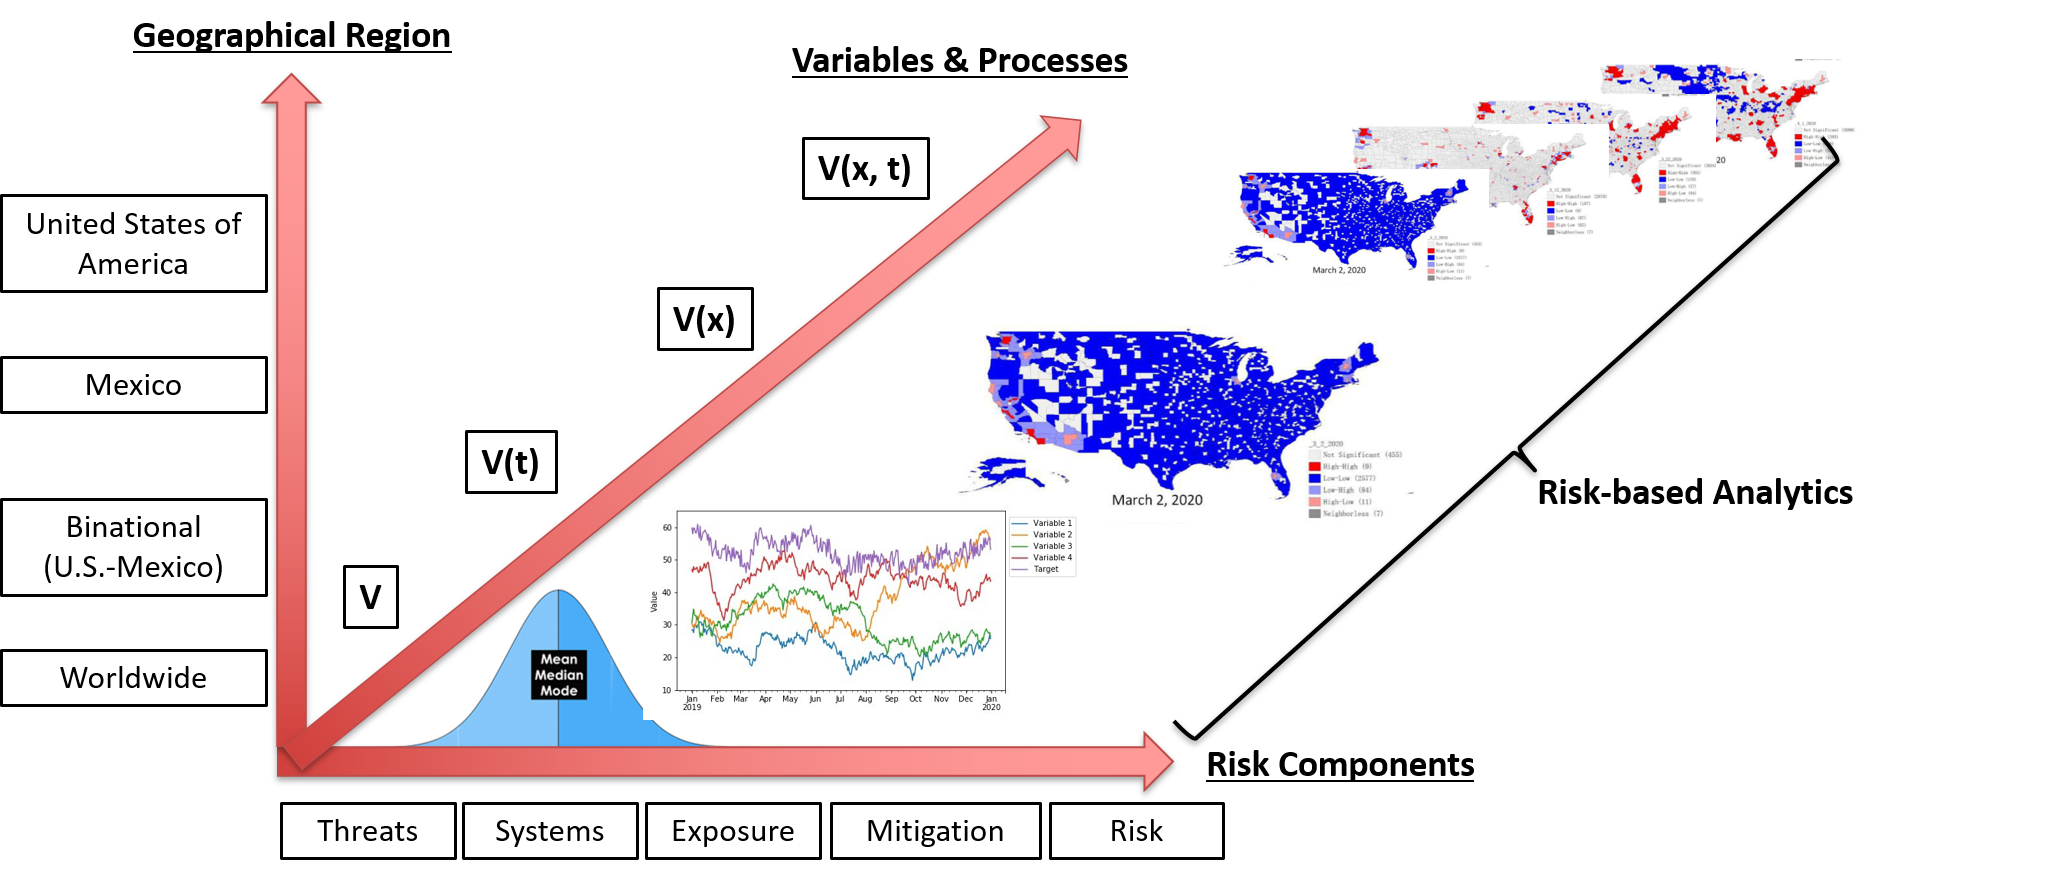
- A 3D conceptual dashboard model was developed to classify information according to our Risk Assessment and Management framework
- Variables are being categorized following our risk framework using the following subcategories:
- V = point variable.
- V(x) = variable as a function of space.
- V(t) = variable as a function of time.
- V(x,t) = variable as a function of space and time.
- A total of 11 variables were categorized as part of the risk communication component of Milestone 4: Risk Bulletin, see sec. 2.3 for more discussion.
- Finalized configuration of on-premise Data-Lake and Cloud Configuration, testing, and operation of the Data-Lake platform has been completed successfully.
APIs are being developed to interface with data sources
Milestone 4: Risk-Bulletin
Updated Research Problem #1 COVID-19 Vaccination
- Vaccine manufacturing capacity and infrastructure has doubled over the past two months. Please refer to section sec. 2.2.3 this document for more information
- Identified leading pharmaceuticals, preordered vaccine supplies, and delivery schedules for Mexico and the U.S.
- Researched expected delivery schedule of Pfizer, Modern, and J&J COVID-19 vaccines in the U.S
- Researched the manufacturing processes of mRNA-based vaccines. From DNA, mRNA, Lipids, formulation, to fill finishing and packaging
- Identified the main stages, components and companies associated with the COVID-19 vaccine manufacturing, packing and distribution in the United States for Pfizer, Moderna, J&J, and Novavax
- Continued with the problem definition, objectives, hypothesis, and literature review of our risk bulletin’s subobjectives a risk communication platform, and a communication platform to restore and create supply chains
U.S. Vaccination Overview and Supply Chain
The most important manufacturing, and distribution sites involved in the COVID-19 supply chain in the U.S. are shown in Fig. 1.
Figure 1: Top U.S. COVID-19 Vaccine Supply Chain Suppliers Facilities.
Pfizer and BioNTech
Pfizer can integrate most of its manufacturing and distribution in the United States. The company, however, was part of operation warp speed for distribution (Slaoui & Hepburn, 2020). According to the company’s yearly review, the company has ten manufacturing facilities and two distribution centers, as shown in Fig. 2 (Inc., 2018), However, only a handful of sites are directly involved in manufacturing its Pfizer-BioNTech COVID-19 Vaccine, as highlighted in Fig. 3 and Fig. 4.
- St. Louis, Missouri plant
- The process starts at this manufacturing plant in the DNA production and raw materials of their COVID-19 Vaccine.
- Drug Formulation in Andover, Massachusetts or Germany facility
- RNA messenger through DNA incubation with genetic building blocks takes place in the Andover facility for the U.S. market while international market is supplied by facilities located in Germany
- Fast shipment to next facility in helicopters or jets at the beggining of the manufacturing process
- Lipids production & other raw materials
- U.K. Croda International
- Formulation, Fill and Finish in Kalamazoo, Michigan
- LNP production step in Kalamazoo is reported to be the bottleneck of the U.S. supply chain. “Combining mRNA and lipids into lipid nanoparticles is the biggest hurdle in the manufacturing process” (Lowe, 2021)
- Two production lines producing 600 vials/min
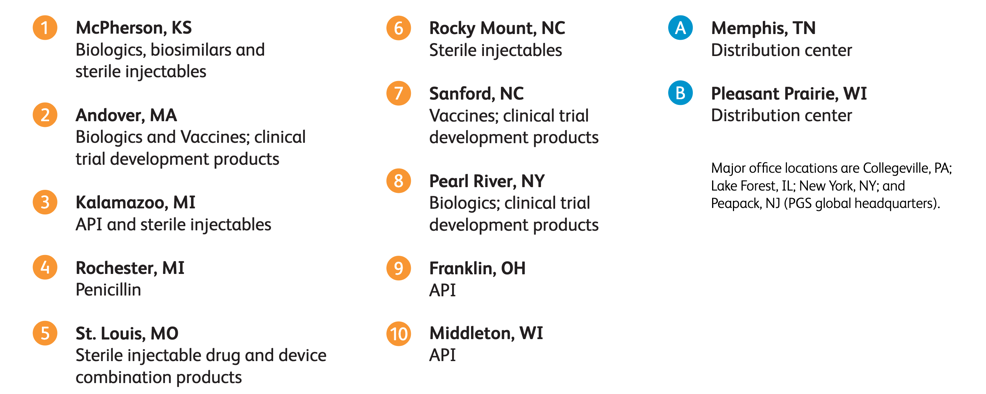
Moderna
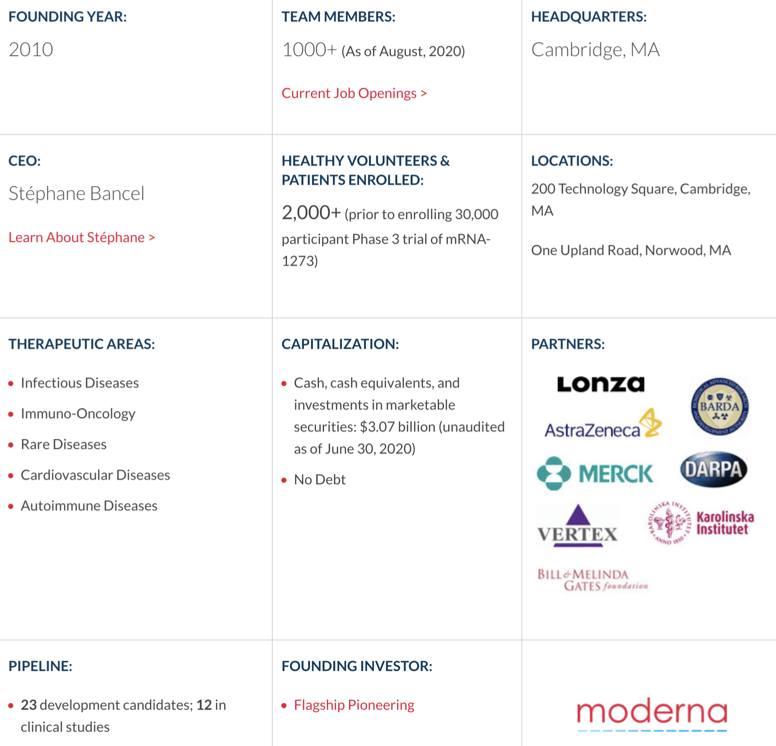
Moderna is a U.S.-based pharmaceutical company founded in 2010 with primary headquarters located in Cambridge, MA, and specialized in the research and development of mRNA-based therapeutics. The company is part of Operation Warp Speed and backed by Venture Capital investments (Moderna, 2021); other takeaways about the company are shown in Fig. 5. The company’s workforce has grown 80% over the past two years, according to LinkedIn data (LinkedIn, 2021).
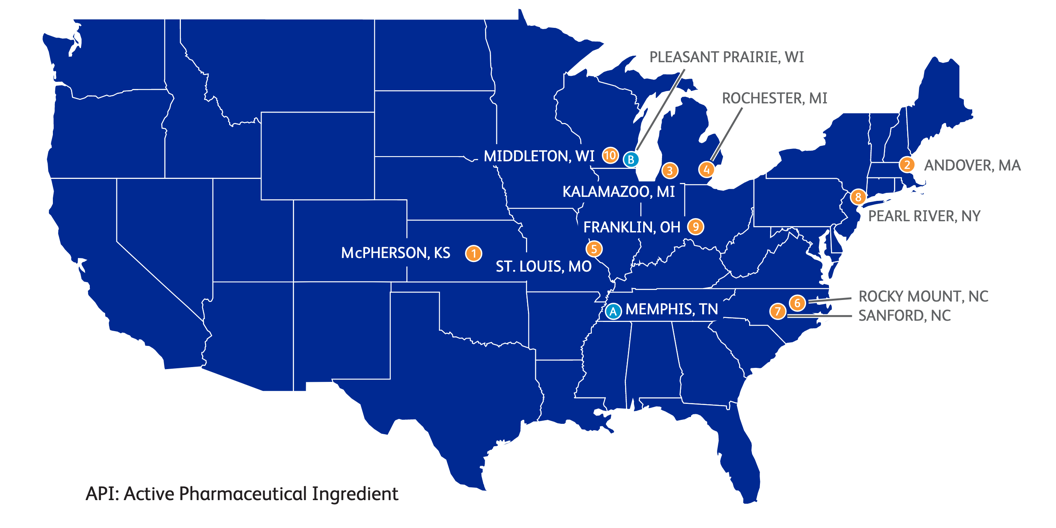
Moderna’s Manufacturing Facilities and Supply Chain Overview
Catalent Pharma is Moderna’s main subcontractor for COVID-19 Vaccine manufacturing in the U.S. (Moderna, 2021),(Neubert, 2021). All U.S. supply comes from Moderna’s dedicated supply chain in the U.S. Supply to locations outside of the U.S. comes from dedicated supply points based outside of the U.S.” (Moderna, 2021)
- Moderna’s Main Plant in MA
- This plant is involved in the mRNA production phase of the COVID-19 vaccine (Carolyn, 2020)
- DNA Production in Portsmouth, New Hampshire
- Moderna is subcontracting Lonza to produce DNA for their vaccines, one of the world’s largest contract development and manufacturing companies.
- It is reported that at least 3 other production lines located in Visp, Switzerland with a capacity of 600k/day are supplying the international market
- Lipid’s production in Boulder, Colorado
- Moderna is subcontracting Corden Pharma, the largest U.S. pharmaceutical manufacturer to produce enough lipids for its vaccine
- At least 2 production lines were installed in Liestal, Switzerland and Chenôve, France for international market
- Formulation & Fill finishing
- Moderna is utilizing the vast manufacturing network of Catelent formulation and fill finishing.
- Packaging and Distribution
- Moderna is part of the U.S. Operation warp speed for both development and distribution. The company uses the central distribution facility
Moderna’s Cold-Chain Distribution and packaging
- 10 doses of 0.5 each into tray
- 12 trays per package
- Up to 192 packages can be shipped per pallet for a total of 230,400 doses
- Moderna uses UPS, FEDEX, DHL and commercial airlines
- Part of OWS for development and distribution
Moderna Distribution Efforts as of February 23, 2021
•Company has supplied 45.4 million doses of Moderna COVID-19 Vaccine to U.S. Government
•CDC Reports that approximately 30.7 million doses of the Moderna Vaccine has been administered
•Additional 33.2 million doses have been produced and are filled in vials and in the final stages of final production and testing
•Expected to deliver 100 million doses to the U.S. Government by end of March 2021
•Expected to deliver 100 million additional doses by end of May 2021 (moved one month forward) followed by another 100 million additional doses by end of July 2021
Figure 7: Main Moderna’s COVID-19 Vaccine U.S. Manufacturing and Distributions locations.
COVID-19 Vaccination Landscape
The World Health Organization (WHO) provides weekly bulletins with the status of COVID-19 Vaccine clinical trials in the world. The bulletin is updated twice per week and includes information from several data sources such as Pubmed (Canese & Weis, 2013), the Cochrane vaccine mapping tool (Boutron et al., 2020), ClinicalTrials.gov (Medicine, 2021), WHO International Clinical Trials Registry Platform (ICTRP) (Organization, 2021) and other researchers in industries with registered trials for clinical information (R&D Blue Print, 2021). In addition, several news organizations and research teams have been reporting periodic updates and keeping track of changes, for instance, the New York Times (Carl Zimmer, 2021) and Bloomberg (Bloomberg, 2021), to mention some examples of such efforts to inform the general public.
According to the sources mentioned before, there are 73 vaccines being researched around the world in clinical trials on humans, 16 have reached the final stages of testing, known as Phase III. Of these, at least 182 pre-clinical vaccines are under active investigation in animals as of Feb. 23, 2021
Table 1 tbl. 1 highlights the leading vaccine manufacturers working in their clinical trials and Table tbl. 2 their corresponding vaccine administration medium.
| Number of doses | Schedule | Candidate vaccines | Percentage |
|---|---|---|---|
| 1 dose | 12 | 16% | |
| Day 0 | 12 | ||
| 2 doses | 45 | 62% | |
| Day 0 + 14 | 6 | ||
| Day 0 + 21 | 17 | ||
| Day 0 + 28 | 22 | ||
| 3 doses | 1 | 1% | |
| Day 0 + 28 + 56 | 1 | ||
| TBD / No Data (ND) | 15 | 21% | |
| Total | 73 | 100% |
| Route of administration | Candidate vaccines | Percentage | |
|---|---|---|---|
| Oral | 2 | 3% | |
| Injectable | 61 | 84% | |
| SC | Sub cutaneous | 2 | 3% |
| ID | Intra dermal | 3 | 4% |
| IM | Intra muscular | 56 | 77% |
| TBD / No Data (ND) | 10 | 14% |
II. Risk Communication Mechanism
R-13 Dashboard Development
The first version of the R-13 dashboard has been reviewed by the SGL (Stochastic Geomechanics Lab) team. This version contains three different dashboards: Binational, U.S.A., and Mexico. The sources of data for these three dashboards are the official COVID-19 Mexico Dashboard, and the John Hopkins COVID-19 U.S.A. Dashboard.
A second version of the R-13 dashboard is currently under development, and the key feature in this version is that all the information from version one plus additional information such as atmospheric and anthropogenic data will be presented in terms of threats, systems, exposures, Risk metrics, and mitigating actions that are required information to perform Risk Assessment and Management.
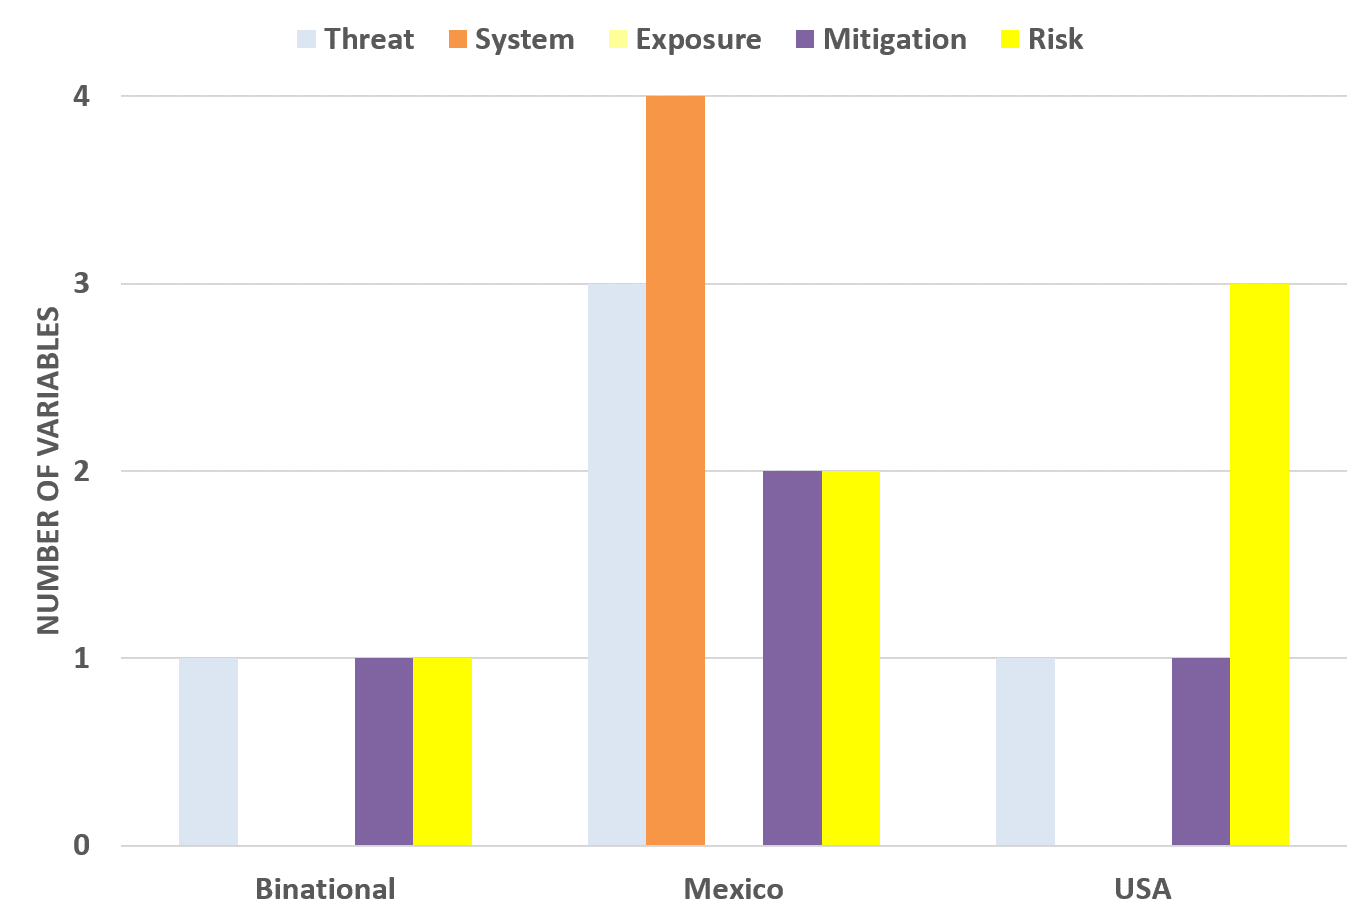
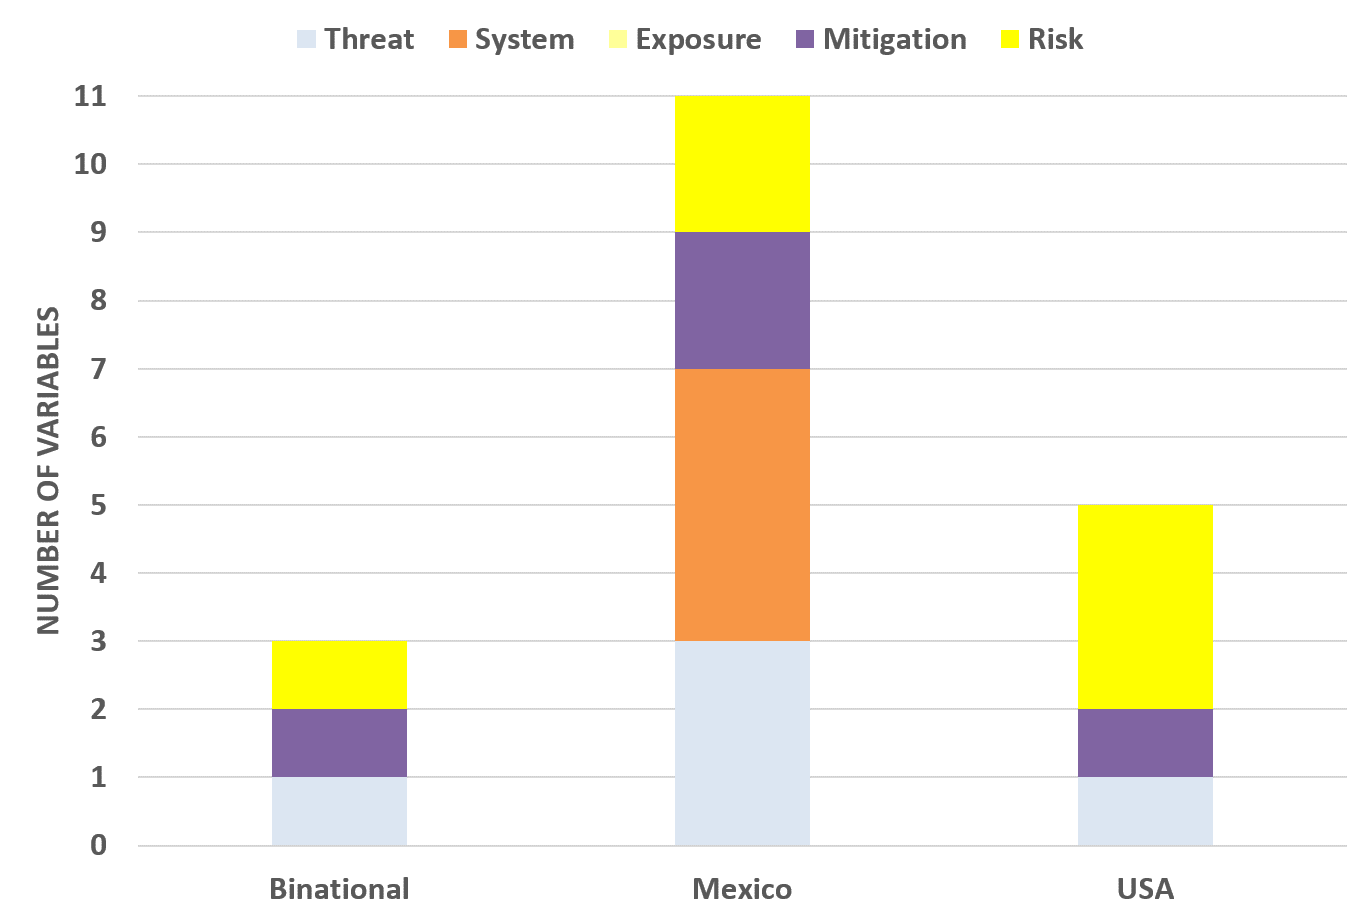
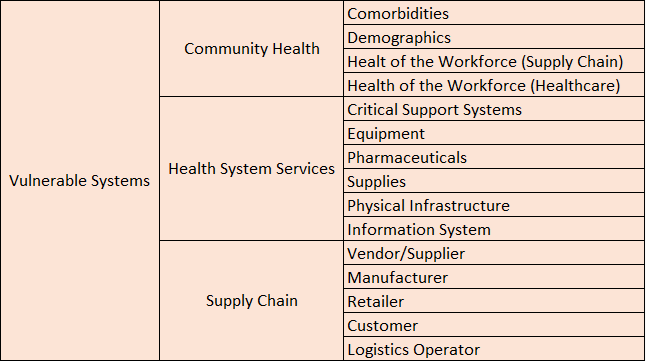
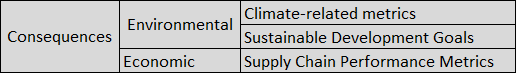
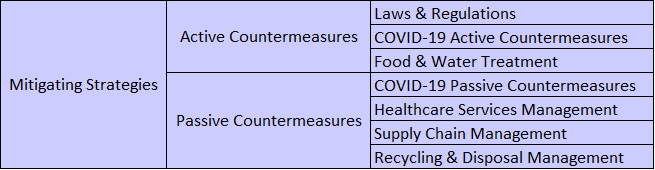
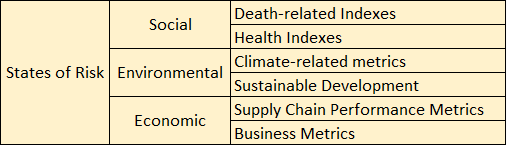
To achieve this goal, a 3D conceptual dashboard model was developed to properly classify information in terms of the five previously mentioned Risk Assessment and Management components (see Fig. 8). This three dimensional model was adopted to perform a classification exercise of all the variables from version one of the R-13 dashboard. A total of 11 variables were classified.
Results from this classification exercise are illustrated in the following Figures 9 and 10. It is important to notice that no exposure information was identified from the version one of the dashboards. In the case of Mexico dashboard, it is reporting almost all the variables from the official COVID-19 Mexico dashboard excluding estimates of COVID-19 confirmed cases, deaths, and active cases. Therefore, no exposure information is available at official Mexico dashboard as well.
Restoration and Creation of Supply Chains
A discussion was started to design the CBTS-SGL dashboard systems to be hosted at the Data Lake System. These included SGL, THEI, Centro-Geo and Plenumsoft Americas, to review a preliminary dashboard design, which will include all risk-based analytics. A literature review conducted earlier in the project and best practices from industry are being discussed to produce the best risk-based dashboard system. Dr. Medina-Cetina introduced the 3D dashboard conceptual model including geographical locations (U.S., Mexico, Binational U.S.-Mexico Dashboards), risk components (threat, vulnerable systems, exposure, mitigating actions, state of risk), and stochastic variables (V, V(t), V(X), V(X,t)).
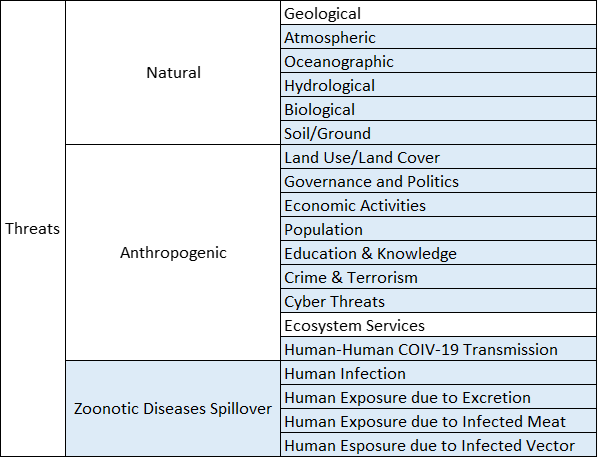
R7 Expert Identification Efforts
For the completion of Milestones #4 and #5 of R7, the SGL team generated a list of the available experts (or group of experts) within CBTS affiliated projects, R13 taskforce members, and other institutions or projects outside CBTS that can be contacted for feedback for the validation of V0.0 of the Risk Assessment & Management models.
Once the preliminary identification of experts and groups was finished, the next step was to assign each one of them to relevant groups and subgroups of the model, according to their expertise and research background.
Figures 11, 15 present the five risk components of the model with groups and subgroups of variables. In the s, a colored cell indicates that an expert, or a group, was identified to provide feedback for validation of the model.
References
Carolyn, T. W. P. Inc., Y. Johnson. (2020). A vial, a vaccine and hopes for slowing a pandemic — how a shot comes to be. https://www.washingtonpost.com/health/2020/11/17/coronavirus-vaccine-manufacturing/
LinkedIn. (2021). LinkedIn company profile, premium insights. https://www.linkedin.com/company/pfizer/insights/
Lowe, D. (2021). Myths of vaccine manufacturing. https://blogs.sciencemag.org/pipeline/archives/2021/02/02/myths-of-vaccine-manufacturing
Moderna. (2021). Moderna provides u.s. COVID-19 vaccine supply update. https://investors.modernatx.com/news-releases/news-release-details/moderna-provides-us-covid-19-vaccine-supply-update-0#:~:text=16%2C%202021%2D%2D%20Moderna%2C%20Inc,the%20U.S.%20Government%20to%20date.
Neubert, J. (2021). Exploring the supply chain of the pfizer/BioNTech and moderna COVID-19 vaccines. https://blog.jonasneubert.com/2021/01/10/exploring-the-supply-chain-of-the-pfizer-biontech-and-moderna-covid-19-vaccines/