
R-13 Risk Bulletin – July 2021
Monthly Risk-Bulleting: July 2021
Date: August 9, 2021
Last revised: Dec 5, 2021
Objective
The objective of the Monthly Risk-Bulletin is to provide an overview a) of lessons learned during the past month in the project, b) of a score-card-type system to communicate the state of risk of supply chains impacted by COVID-19 supporting health infrastructure and the workforce between the U.S. and Mexico, and c) of a communication system to facilitate the restoration of broken supply chains and the formation of new ones to reactivate trade between U.S. and Mexico. The report aims to offer valuable insights to the general public and decision-makers towards informed preventive actions to reduce the current pandemic’s potential impact on critical supply chains and better strategize about feasible social, economic, and environmental risk-mitigating actions against COVID19 and converging threats. This bulletin is jointly produced by the project’s PIs, the project’s contractors, and the U.S. binational task force serving as advisors to the project.
| Project PIs | |
|---|---|
| Zenon Medina-Cetina, PhD – PI | Gregory Pompelli, PhD – Co-PI |
| Matt Cochran, DVM, MIA – Co-PI | Maria Jose Perez-Patron, PhD – Co-PI |
| Miriam Olivares, GISP – Co-PI |
| Document prepared with the support of: | Reviewed & Approved by: |
| Guillermo Duran | Dr. Medina-Cetina – PI |
| PhD Students SGL – Graduate Research Assistants | Date: 11/26/2021 |
Suggested citation:
Medina Cetina, Z., Pompelli, Gregory, Cochran, Matt, Olivates, Miriam, Perez-Patron, Maria J., Duran, Guillermo, Alvarado, Juan Pablo (2021). CBTS-R13: U.S.-Mexico Risk Taskforce to Support the Health Supply Chain Systems for Infrastructure and Workforce Threatened by the COVID19 Pandemic. https://r13-cbts-sgl.engr.tamu.edu/
@misc{Medina2021,
   author = {Medina Cetina, Z. and Pompelli, Gregory and Cochran, Matt and Olivates, Miriam, Perez-Patron, Maria J. and Duran, Guillermo and Alvarado, Juan Pablo and Alexi, Allen, and Torres, Cesar, and Lopez-Acosta, Araceli, and Sanchez-Siordia, Oscar, and Rojas, Minerva},
   title = {*CBTS-R13: U.S.-Mexico Risk Taskforce to Support the Health Supply Chain Systems for Infrastructure and Workforce Threatened by the COVID19 Pandemic*},
   url={https://r13-cbts-sgl.engr.tamu.edu/},
   year={2021},
   month={July}
}
R-13 Risk Bulletin – July 2021
- Objective
- Introduction
- I. Project Status & Lessons Learned
- II. Risk Communication Mechanism
- III. Restoration and Creation of Supply Chains
- References
Introduction
This month included many important milestones for the taskforce. Model validation workshops continued and were conducted with experts from many industries and disciplines, and the feedback was taken into account and used to tweak our models to best represent reality. The Dashboard V2.0 was released, and important milestones were reached on each of our projects.
I. Project Status & Lessons Learned
Literature review for Semantic Analysis
Tools and databases for conducting Bibliometric Analysis were reviewed. A scientific article reviewing these tools was utilized to inform the methodology for this project. – ScientoPyUI: uses Python to acquire data from World of Science and Scopus. It contains document filtering, preprocessing, filtering and duplication removal, and documents metadata and citation.
- BiblioShiny: uses R to acquire data from World of Science and Scopus. It can separate information by any number of criteria. Maps can be exported in a range of file types.
- Bibliomaps: uses Python to acquire data from World of Science and Scopus. Data acquisition, filtering, processing, analysis and visualization tools are available.
II. Risk Communication Mechanism
CBTS-SGL-R13 Dashboard V2.0 Release
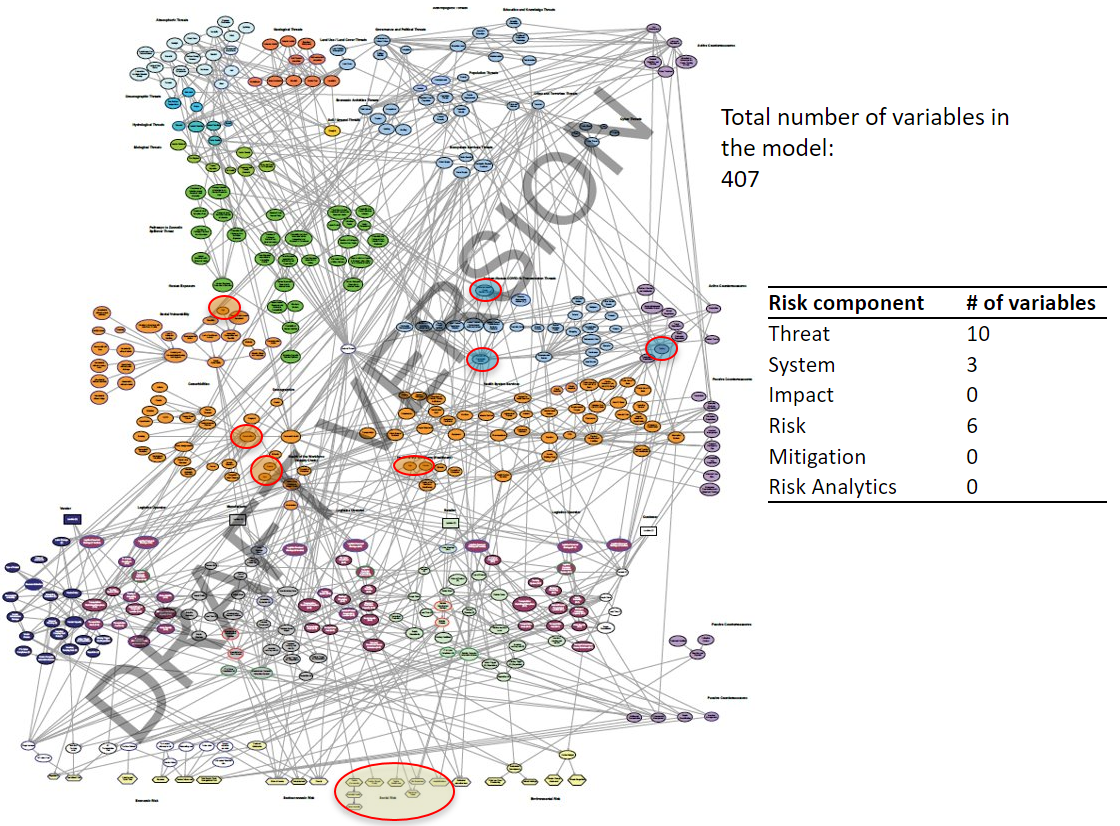
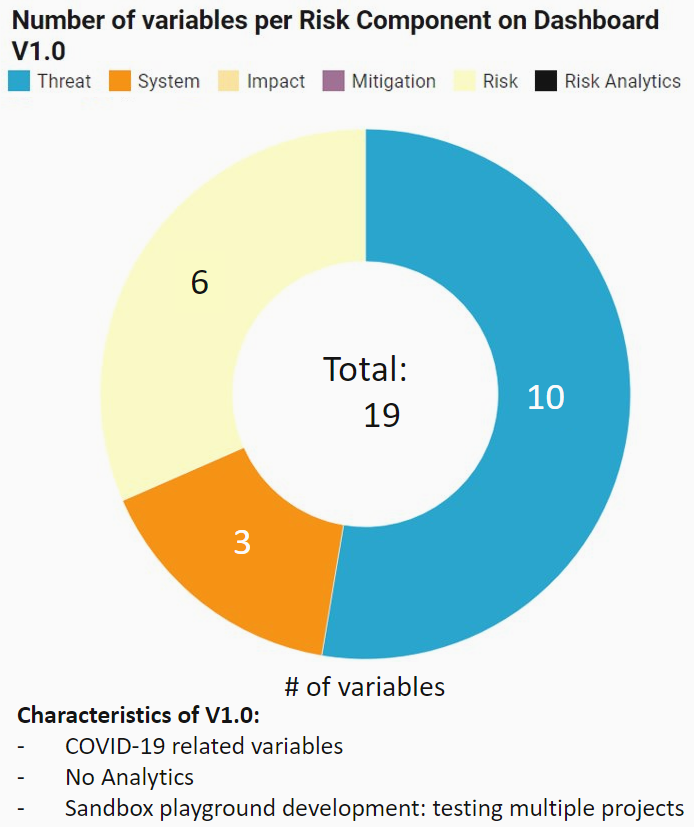
A review of Dashboard V1.0 variables was performed to identify the total number of variables contained in this version, and their location in the R-7 Risk Assessment and Management Model. Fig. 1 and Fig. 2 illustrate this review.
The Dashboard V2.0 was officially released on July 9th, 2021, during the R-13 Taskforce meeting. In this version, the menu was divided into two sections: Risk Components and Risk Assessment and Management. New modules were added such as Border States Analysis, Mobility, Mobility Map, Excess Deaths for both Mexico and US, etc. Please visit the following dashboard site for more information: https://cbts-sgl.engr.tamu.edu/
Risk Communication Platform Literature Review
A literature review was conducted, pertaining to similar platforms and tools that help foster connections between businesses in a supply chain, which would help inform the methodology and structure in the creation of the Risk Communication platform.
Two standout databases which provided a roadmap for features and structure to implement into the platform were GovShop and ThomasNet. Both contain data on business location, industry contact information. They also contain request-able data on past contracts, products and availability, insight on supply chains, industry publications and news, and the ability to vet each business.
(Mattos & Laurindo, 2015) is an article reviewed detailing the intricacies of creating electronic connections between businesses in a supply chain. It explains that while electronic communication in a supply chain increases efficiency and performance for the business, and makes it easier to handle problems when they arise. It also requires high degree of data collection and standardization, transparency and technical infrastructure.
The main takeaways of this review are that 1. More emphasis should be put on social connections and fostering a collaborative environment. 2. There should be more than just data to attract users, implement articles or newsletters. 3. The platforms reviewed generally provide a database and at least one extra feature. – Example; relevant articles on ThomasNet. Questions Posed: 1. What articles or features can be used to incentivize platform use? 2. There is a gradual shift towards centralizing platforms for SCM. – Can this be used to our advantage? Disadvantage?
The key inspirations gleaned from this review: 1. Implement more collaborative elements. 2. Ability to transact – possible long term goal. 3. Instead of passively allowing businesses to connect, actively foster engagement. 4. Implement or connect to managerial features. There are available platforms used for employee management as well as supply chain management. They are generally bulky and expensive, can explore partnerships. 5. Bolster communication systems: increased communication creates strategic advantage for companies. Incentivizing and facilitating communication on our platform is a net positive.
Risk Communication Platform Updates
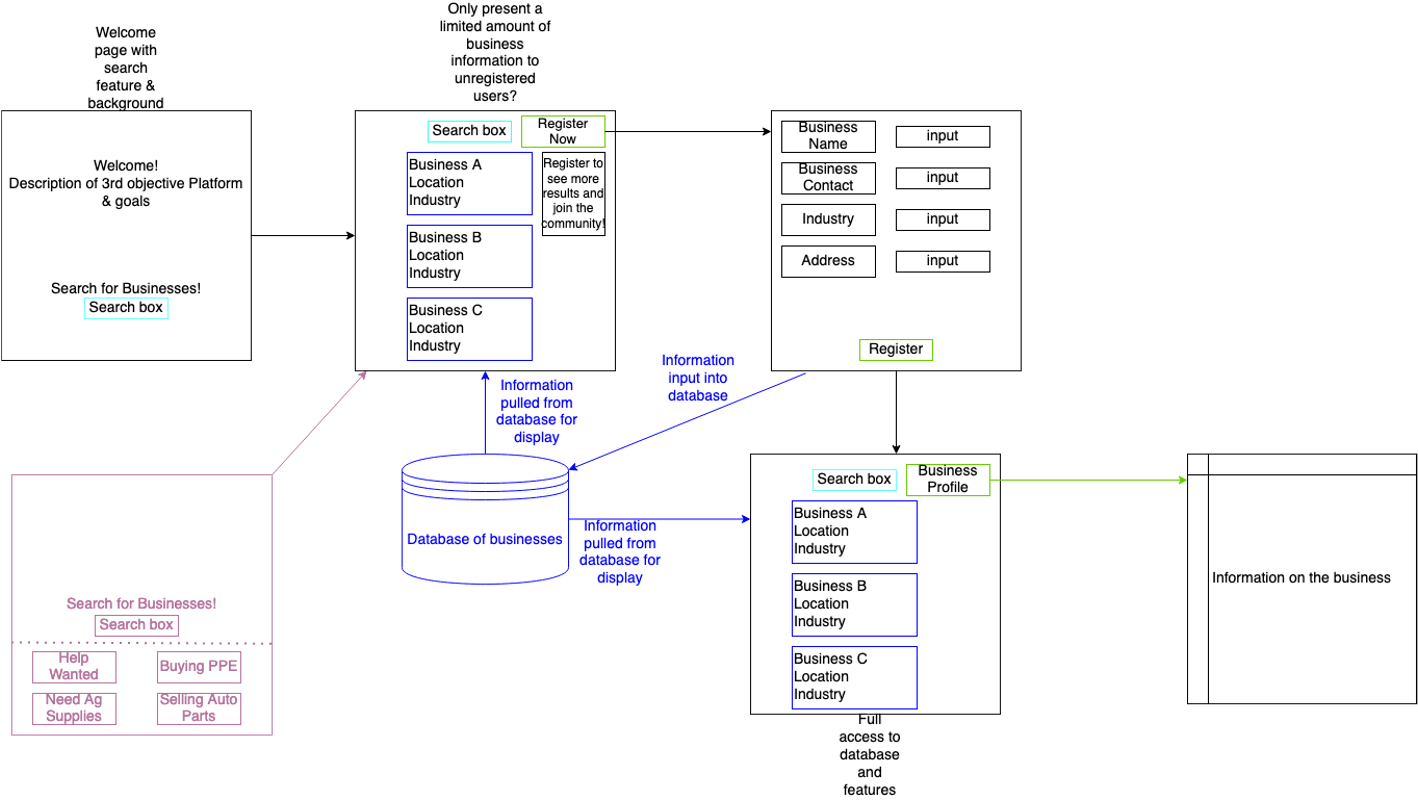
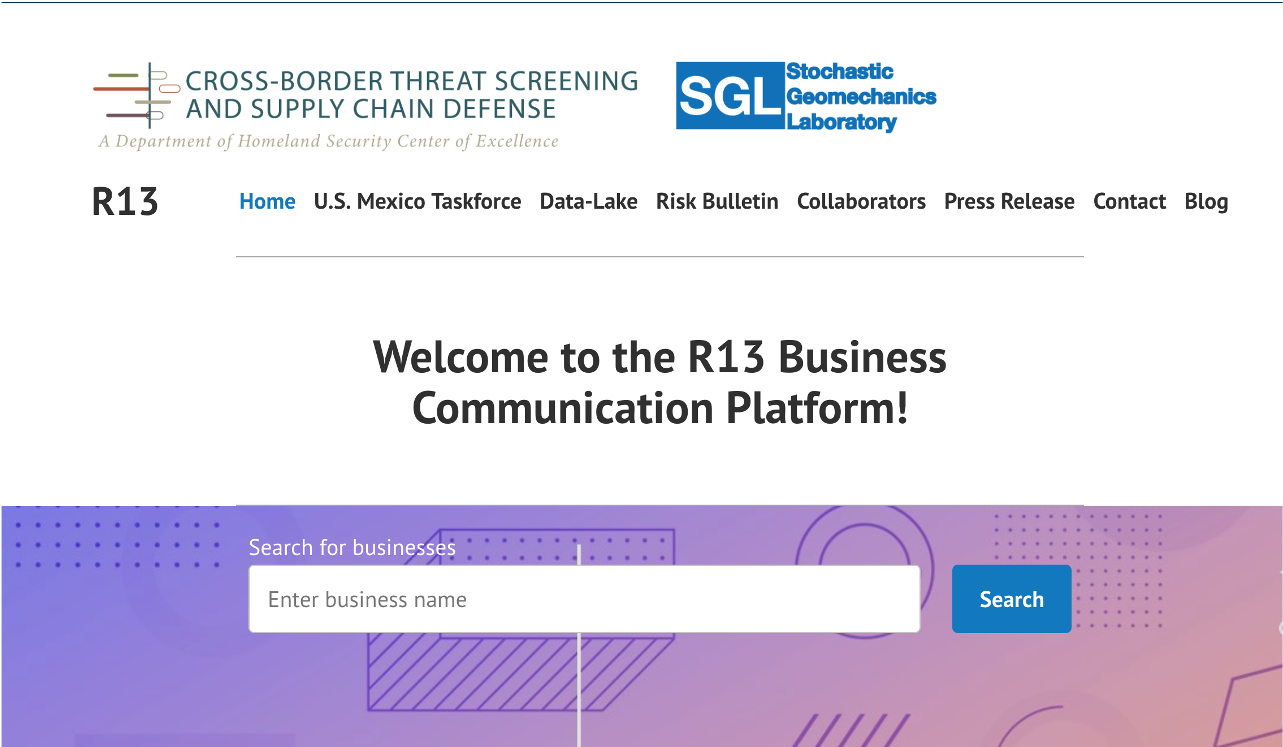
The Risk Communication Platform seeks to foster new connections between businesses and help repair supply chains disrupted by COVID19 or other natural disasters.
The conceptual model for the platform is detailed in Fig. 3.
The welcome page of the web platform will contain the standard title, menu and a search bar which provides access to the main database display webpage. In addition, the inclusion of some of our articles, publications or industry news could be beneficial to display on this page, an example of which can be found in Fig. 4.
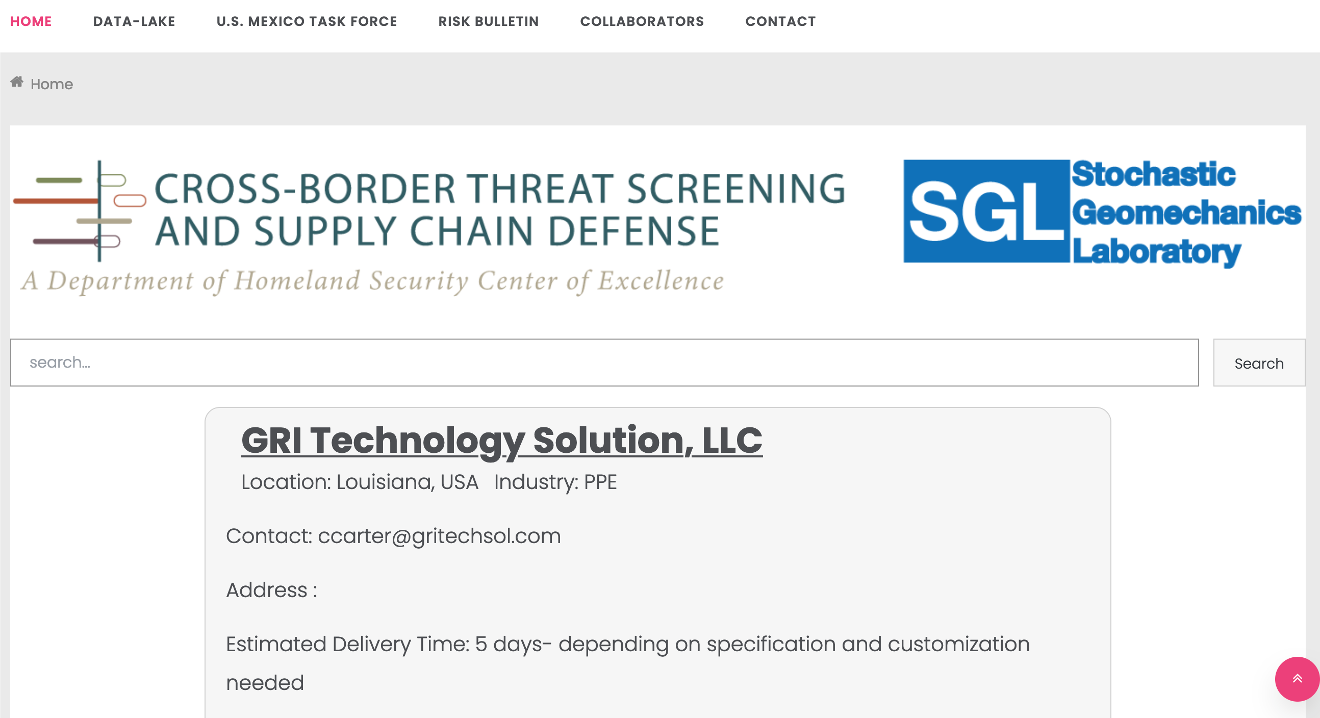
The database display page is in-progress Fig. 5. Complete functionality: – Database of suppliers.
- Database connection to website.
- Display content in separate “cards”.
In progress: – Configure which attributes are visible on each card.
- Configure the styling – change design.
- Add dynamic search feature based on database criteria.
To do: – Link each ”card” to personalized profile.
Risk Scorecard Updates
Update on Variables in the model:
- SVI CDC values are streamed, aggregated and percentages are either calculated or streamed.
- Each SVI CDC variables are ranked with a range from 0-1 with the formula (rank of row in its partition – 1) / (number of rows in the partition – 1).
- Higher percentile->higher contribution.
- Except for per capita income variable where higher percentile position means less contribution. (PCI=1-PCI)
- All CCPR variables except RT-PCR diagnostic test, were extracted directly since they are already in proportion to the population.
- RT-PCR diagnostic test is normalized to the county’s total population.
- The same condition is applied to the RT-PCR diagnostic test (LABTEST=1-LABTEST).
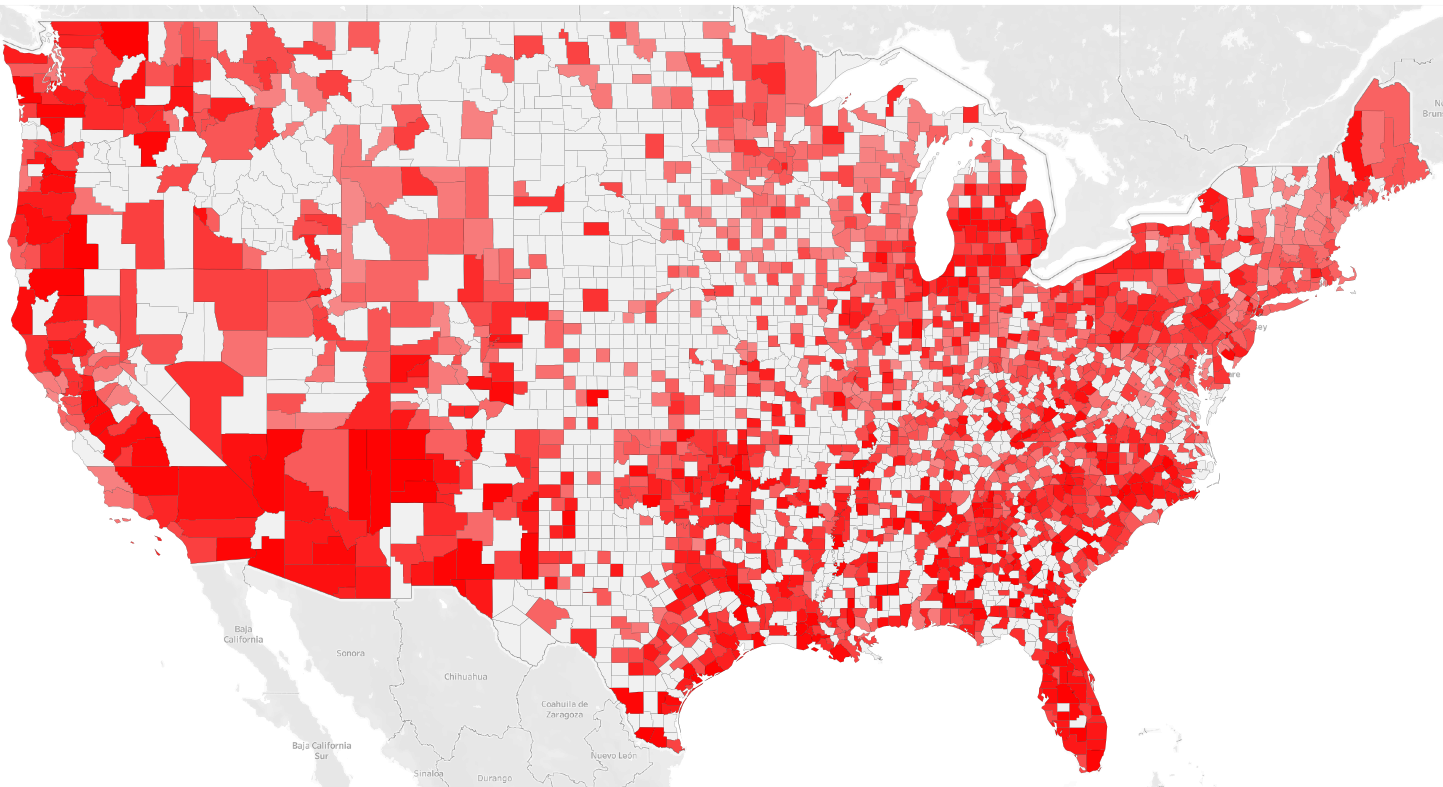
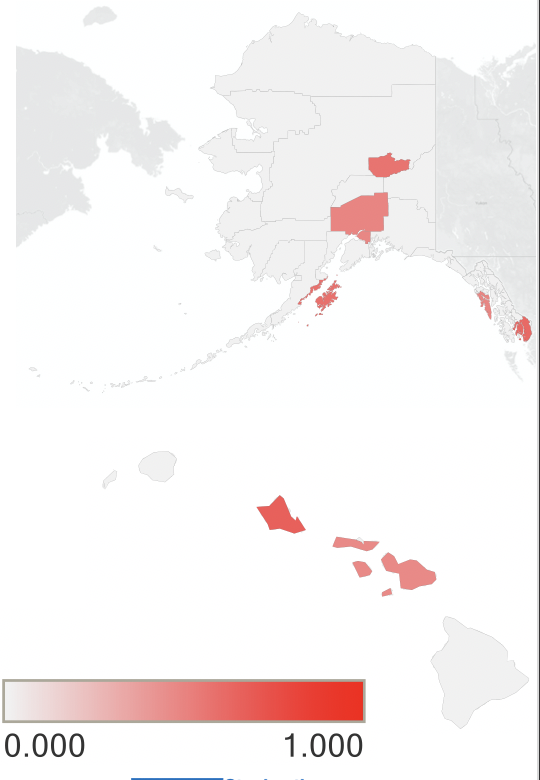
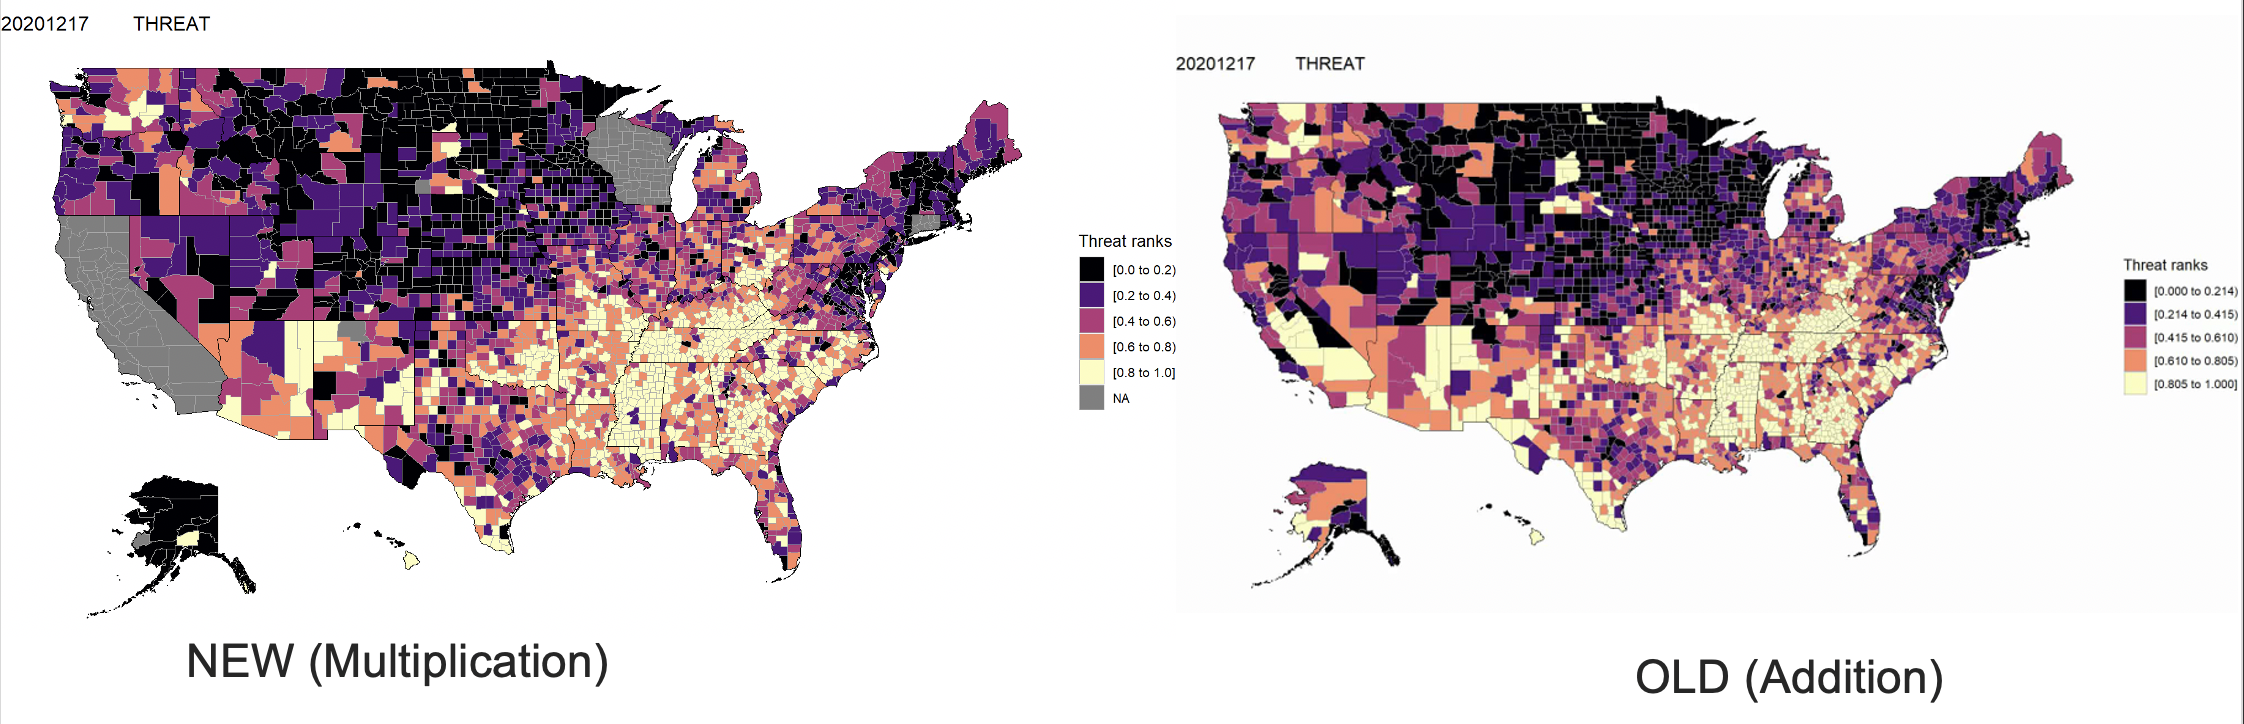
The Version 1 map of Threats based on calculated statistics is displayed in Fig. 6 and Fig. 7.
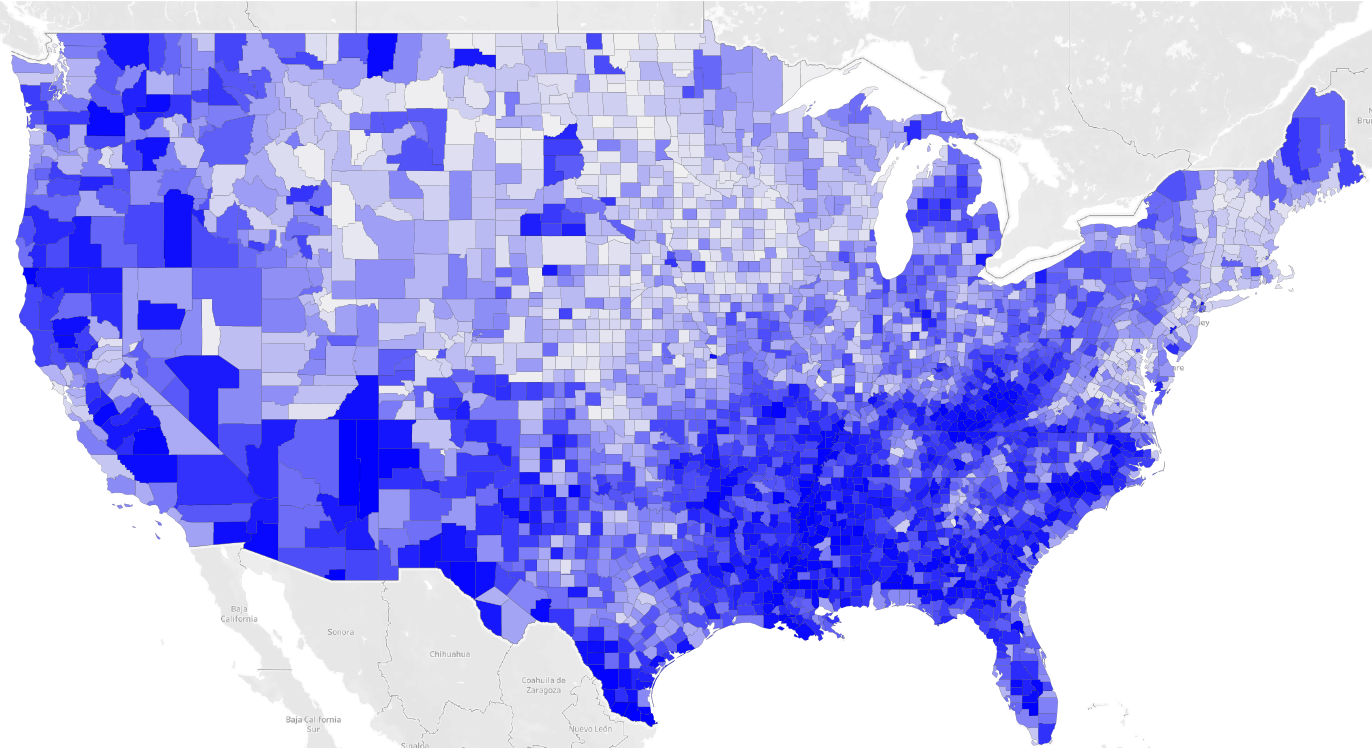
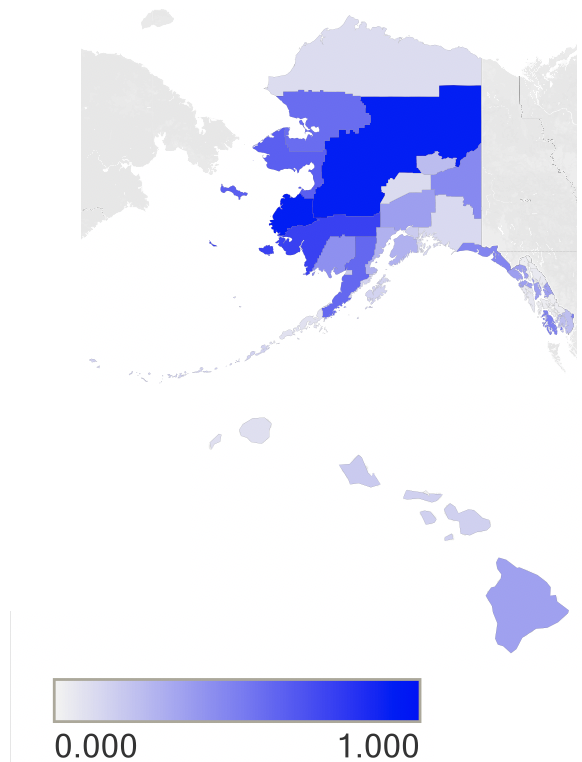
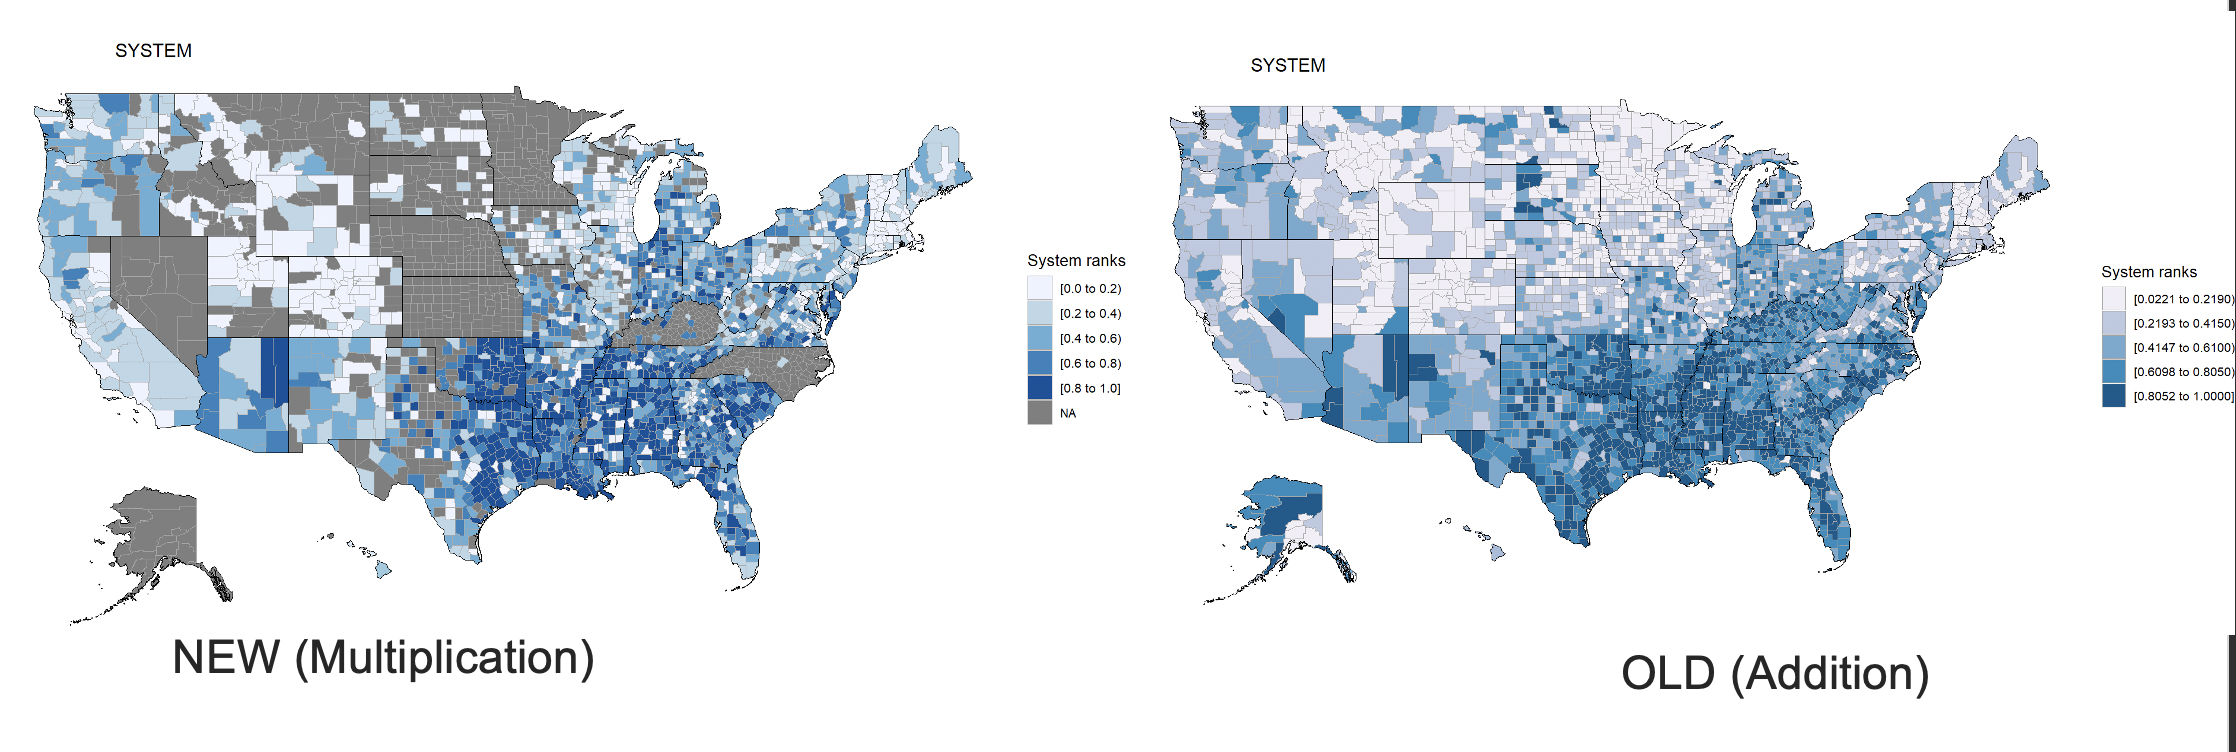
The Version 1 map of Systems based on calculated statistics is displayed in Fig. 8 and Fig. 9.
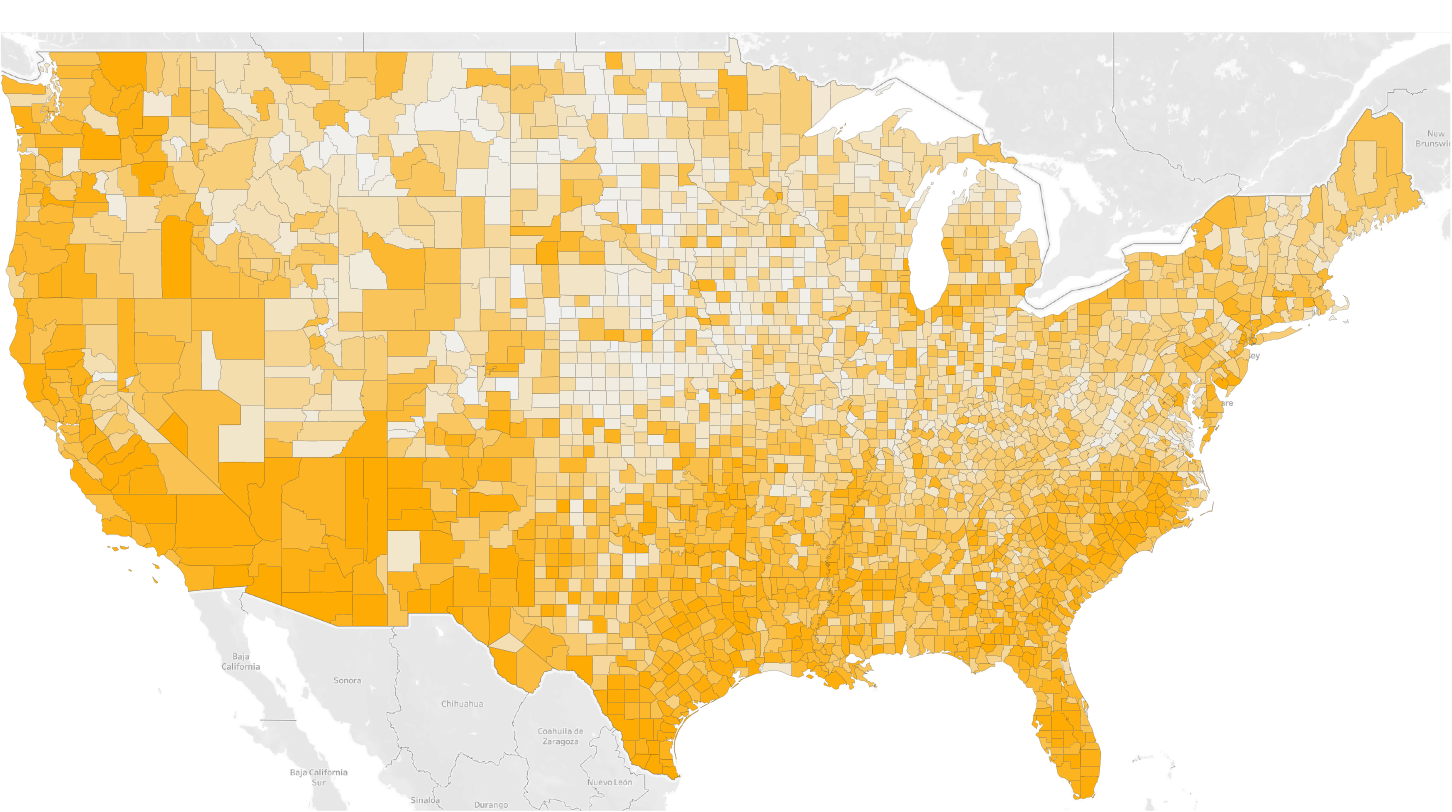
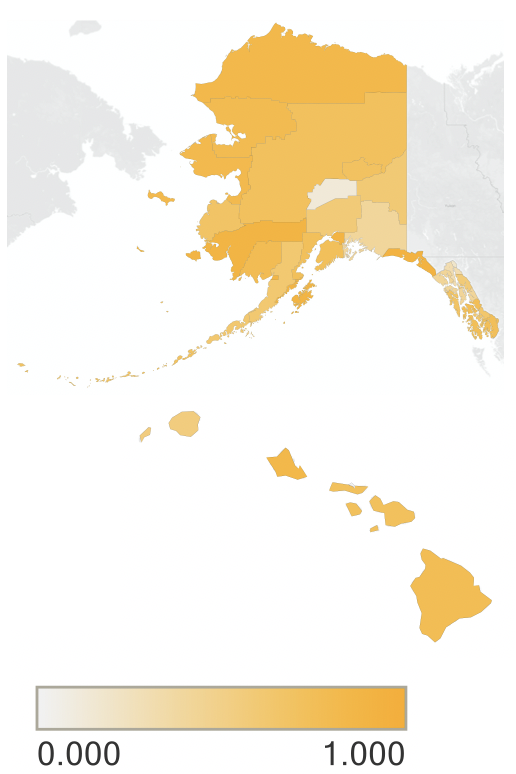
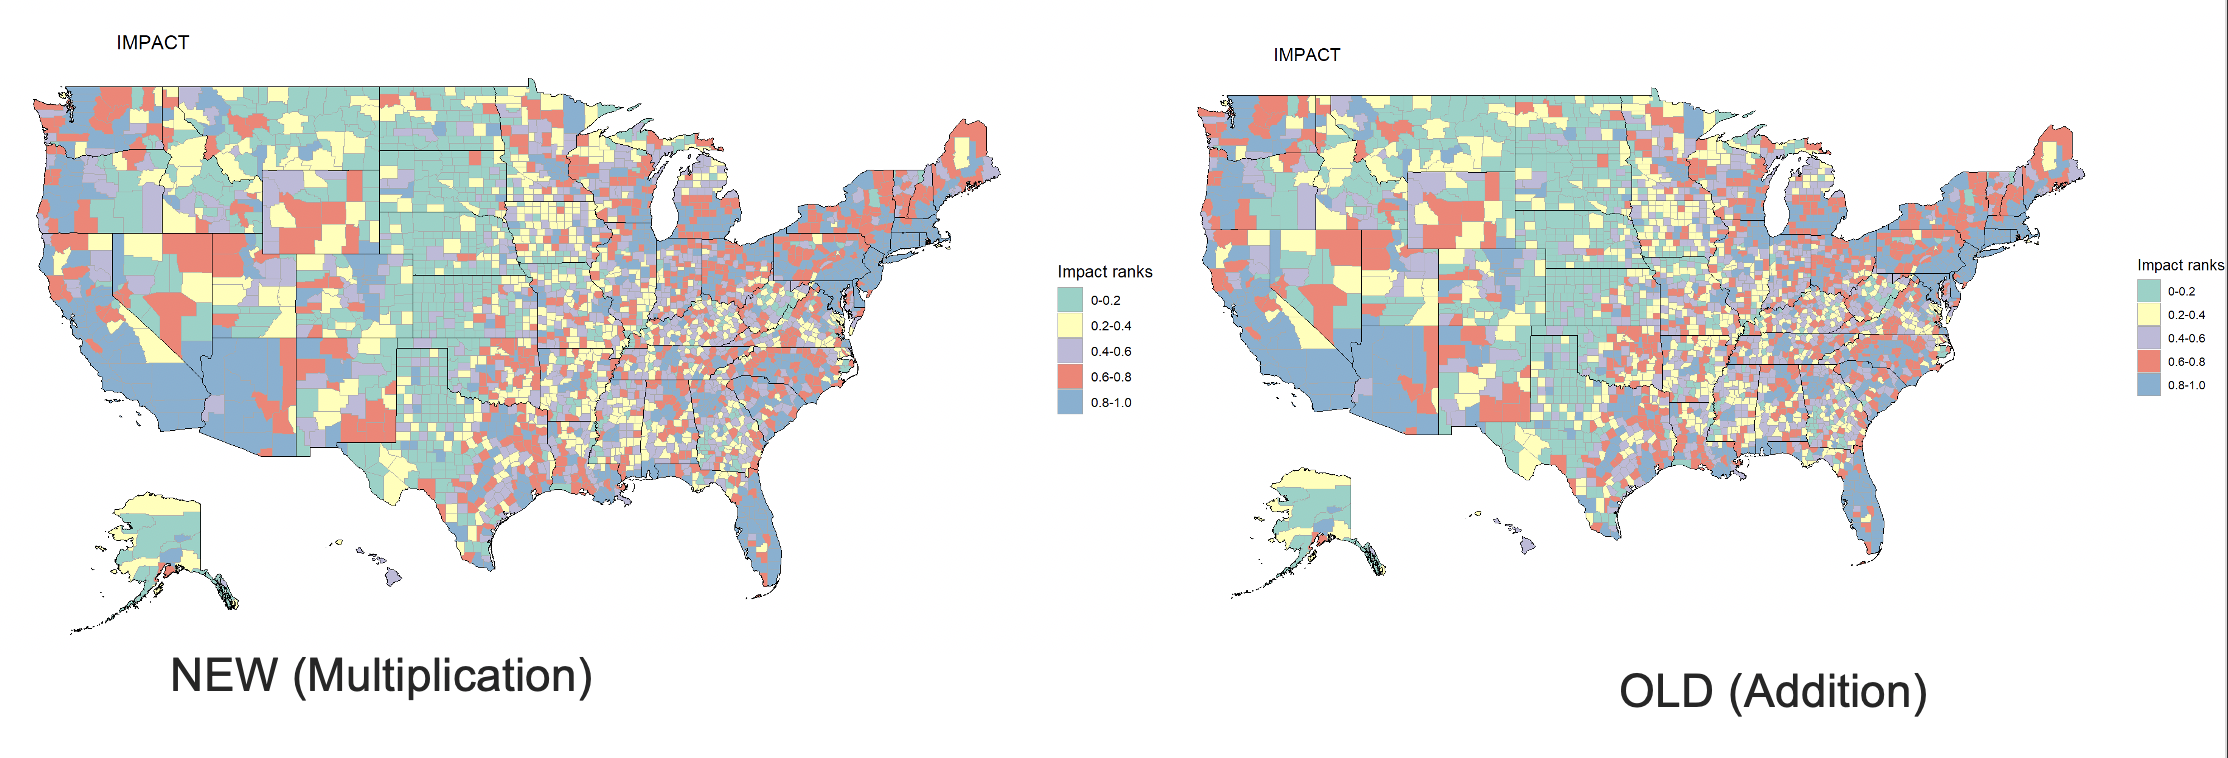
The Version 1 map of Impacts based on calculated statistics is displayed in Fig. 10 and Fig. 11.
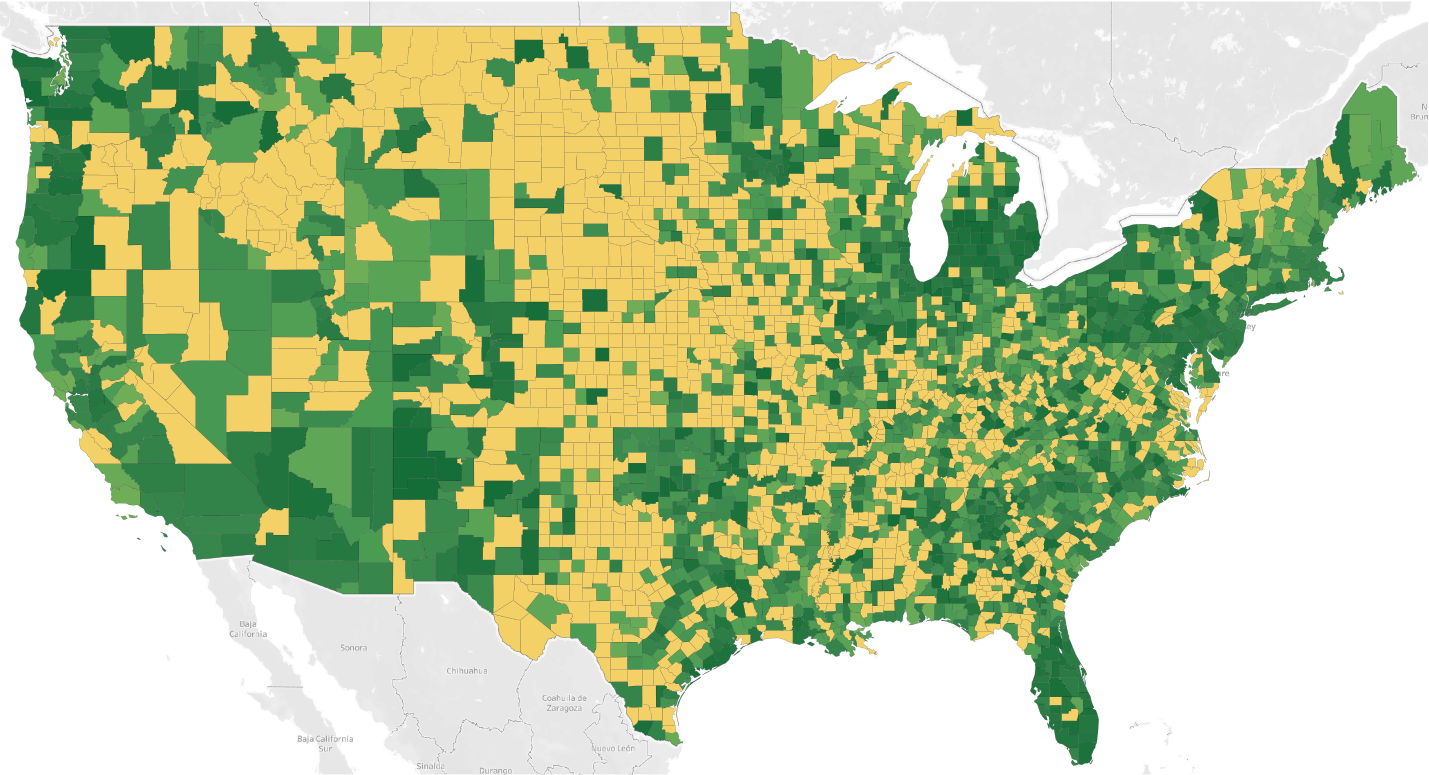
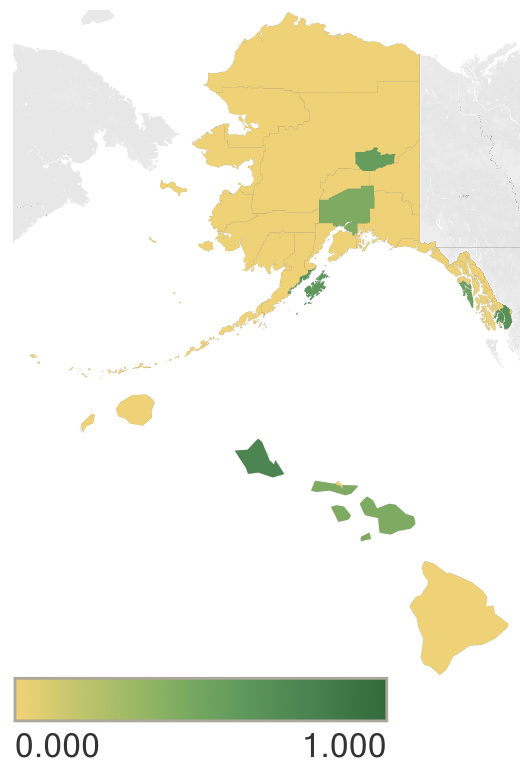
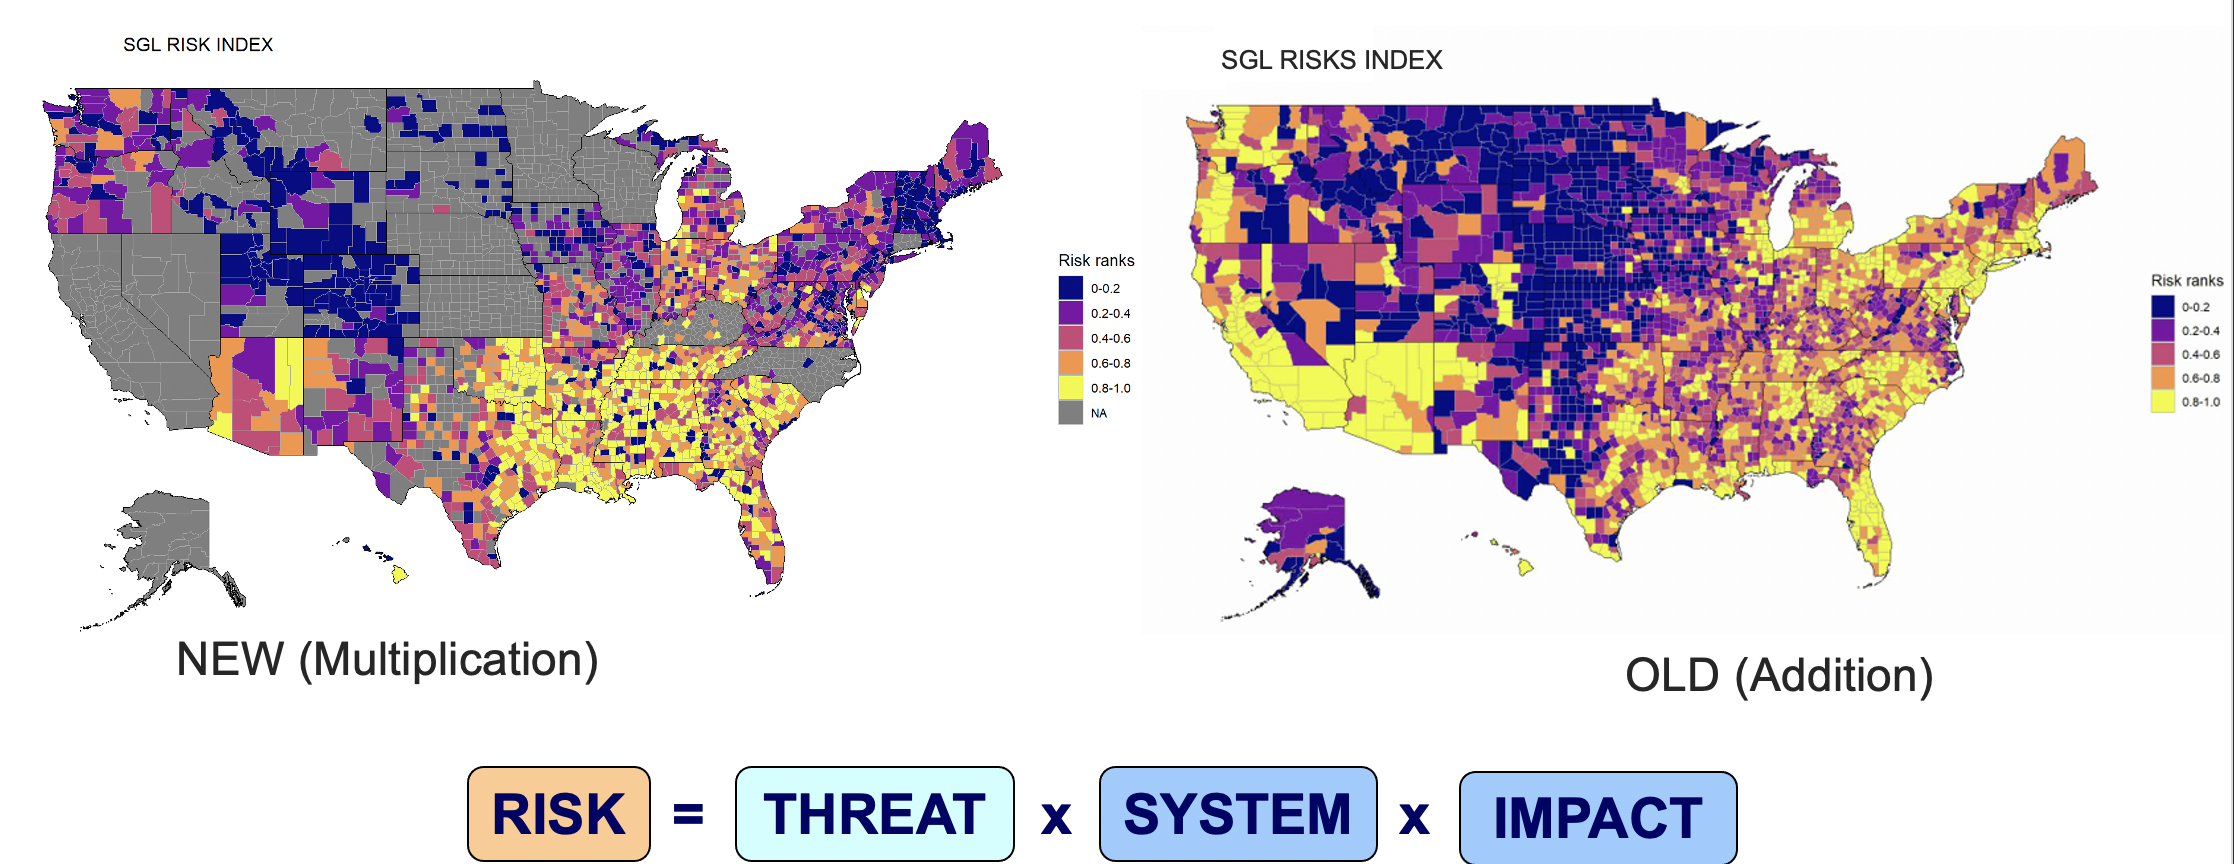
The Version 1 map of Risks based on calculated statistics is displayed in Fig. 12 and Fig. 13.
Due to incomplete data, some States’ risk indices are still being rendered as NA.
III. Restoration and Creation of Supply Chains
Literature Review
- Panjiva Data
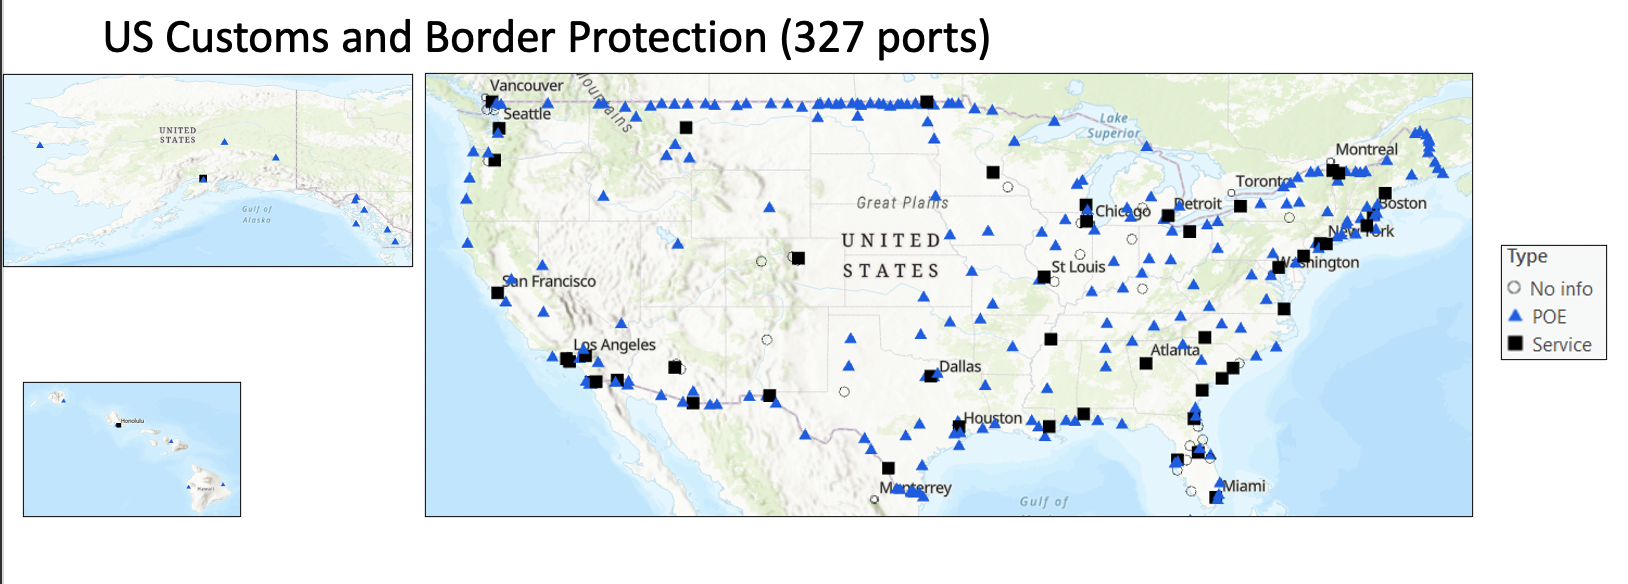
A review of Panjiva Data on US Ports was conducted to determine data that was available Fig. 18. – Able to get data daily, but updated weekly after data cleanup and organization. – Imports delayed by 7 days. – Exports delayed by 23 days. – Overall data does not match because export data is not fully reported.
- Social Media Data A search of professors at Texas A&M who conduct social media data mining was conducted to reach out for support with social media company interaction as well as methodology assistance Fig. 19.

Different platforms for twitter data mining, such as GNIP and Discovertext were also considered, as Twitter and comparable companies are difficult to work with and glean data from.