Actionable Information – Research Briefs – 7 – Index of stringency in containment measures, their impact on economic activity and mobility reduction.
Suggested citation:
Pineda-Antunez, C., Marquez-Urbina, J., Gonzalez-Farias, G., Medina-Cetina, Z., Pompelli, G., Cochran, M., Olivares, M. & Perez-Patron, M (2021). Actionable Information – Research Briefs – 7 – Index of stringency in containment measures, their impact on economic activity and mobility reduction. https://r13-cbts-sgl.engr.tamu.edu/actionable-information-research-briefs-7-index-of-stringency-in-containment-measures-their-impact-on-economic-activity-and-mobility-reduction/
@misc{Gonzalez2021,
   author = {Pineda-Antunez, Carlos and Marquez-Urbina, Jose Ulises and Gonzalez-Farias,Graciela and Medina-Cetina, Zenon and Pompelli, Gregory and Cochran, Matt and Olivares, Miriam and Perez-Patron, Maria Jose},
   title = {Actionable Information - Research Briefs - 7 - Index of stringency in containment measures, their impact on economic activity and mobility reduction},
   url={https://r13-cbts-sgl.engr.tamu.edu/actionable-information-research-briefs-7-index-of-stringency-in-containment-measures-their-impact-on-economic-activity-and-mobility-reduction/},
   year={2021},
   month={May}
}
Objective: Explore the association between the government’s response to contain the pandemic and measurements of mobility reduction, economic activity, and unemployment.
Stringency index of containment measures: This index is estimated by the project “The Oxford COVID-19 Government Response Tracker.” The index is based on collected information for nine indicators related to the governments’ containment measures to mitigate COVID-19’s pandemic.
Economic activity index: In the case of Mexico, we use the Global Economic Activity Index (IGAE by its Spanish initials), which measures the evolution of multiple economic sectors and is expressed as percentage terms regarding the activity levels of 2013. For the United States, we use the Industrial Production index, which measures the evolution in the manufacturing, mining, electricity, and gas utility sectors. The index is also expressed in percentage terms referencing 2012.
Mobility reduction index: We use the mobility index in workplaces published by Google’s local mobility report. The mobility index is inverted for its interpretation as a reduction in mobility; in this way, it is also interpreted as an indicator of the adoption of measures to contain the epidemic (the higher the values, the greater the adoption by the population).
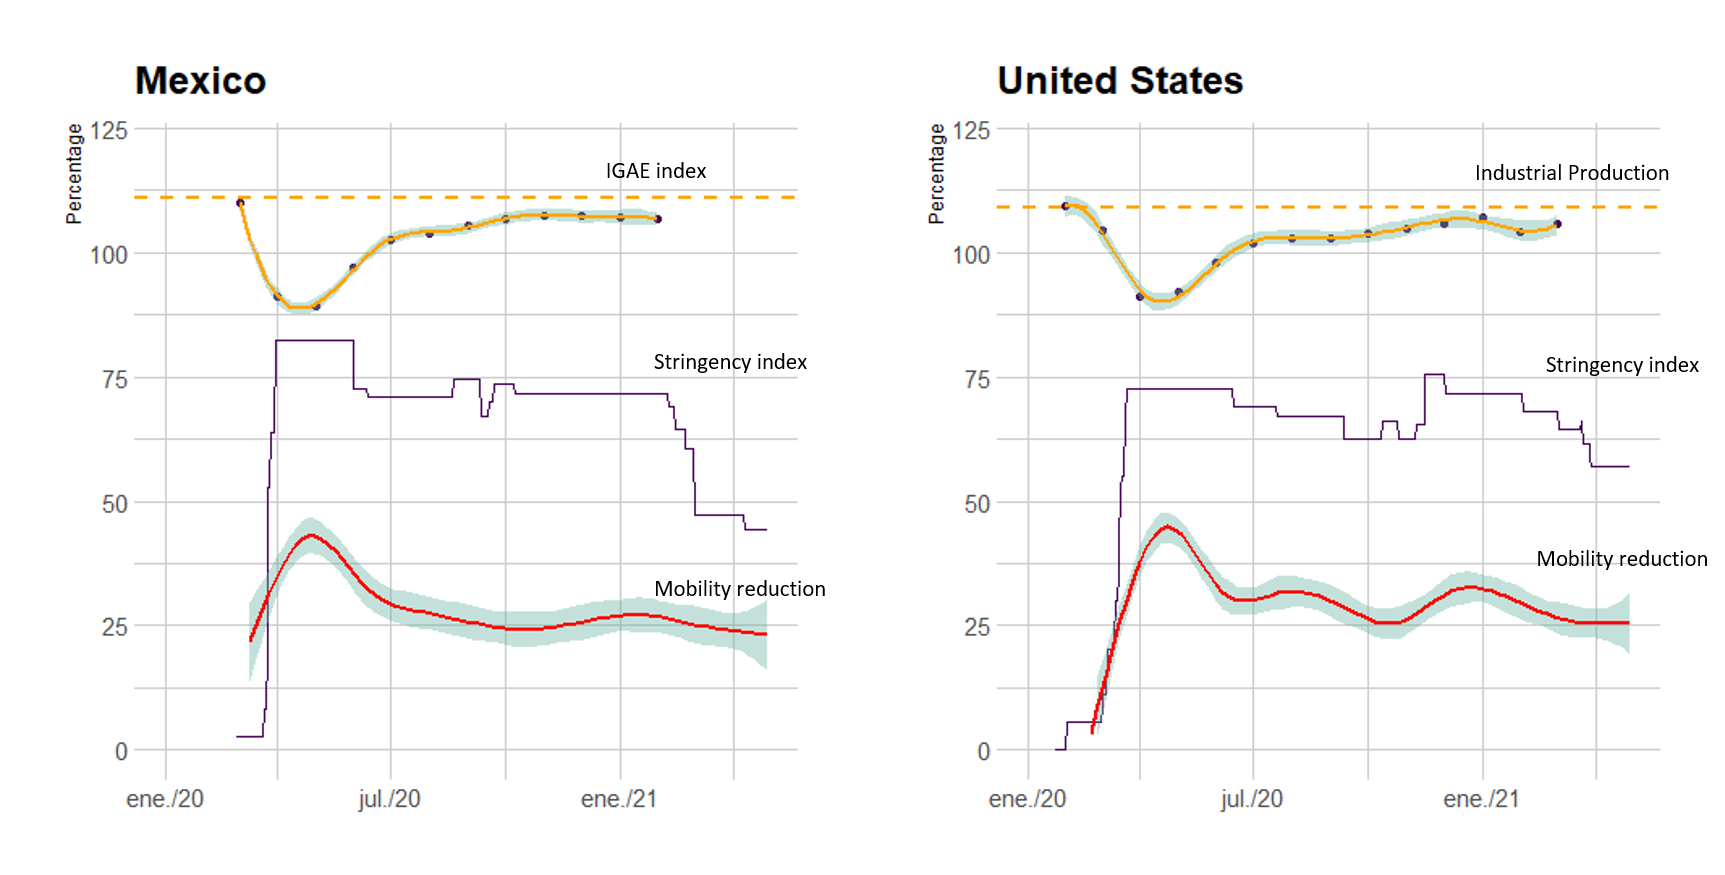
Results: Fig. 1 shows the change in the stringency of the containment measures over time. In Mexico, the strictest level was reached during the first months of the pandemic. The measures were relaxed after June 2020, and the lowest levels of stringency were reached from February 2021. The maximum level of rigor negatively impacted the IGAE index, which fell up to 22 percentage points with respect to the pre-pandemic levels. Up to February 2021, the pre-pandemic levels of economic growth had not been achieved. The maximum level of rigor was also reflected in a stricter adoption of the measures (more significant reduction in mobility in work areas). Subsequently, the mobility increased, and no other considerable mobility reductions were observed in the rest of the period. The United States reached a moderately high level of stringency of the containment measures at the pandemic’s beginning. From June 2020, the measures were relaxed; however, the initial rigor was recovered during November and December 2020. As in Mexico, the Industrial Production index was negatively affected, falling 18 percentage points in April 2020.
Figure 1: Comparison between indices of economic activity, reduction in mobility and stringency of the containment measures.
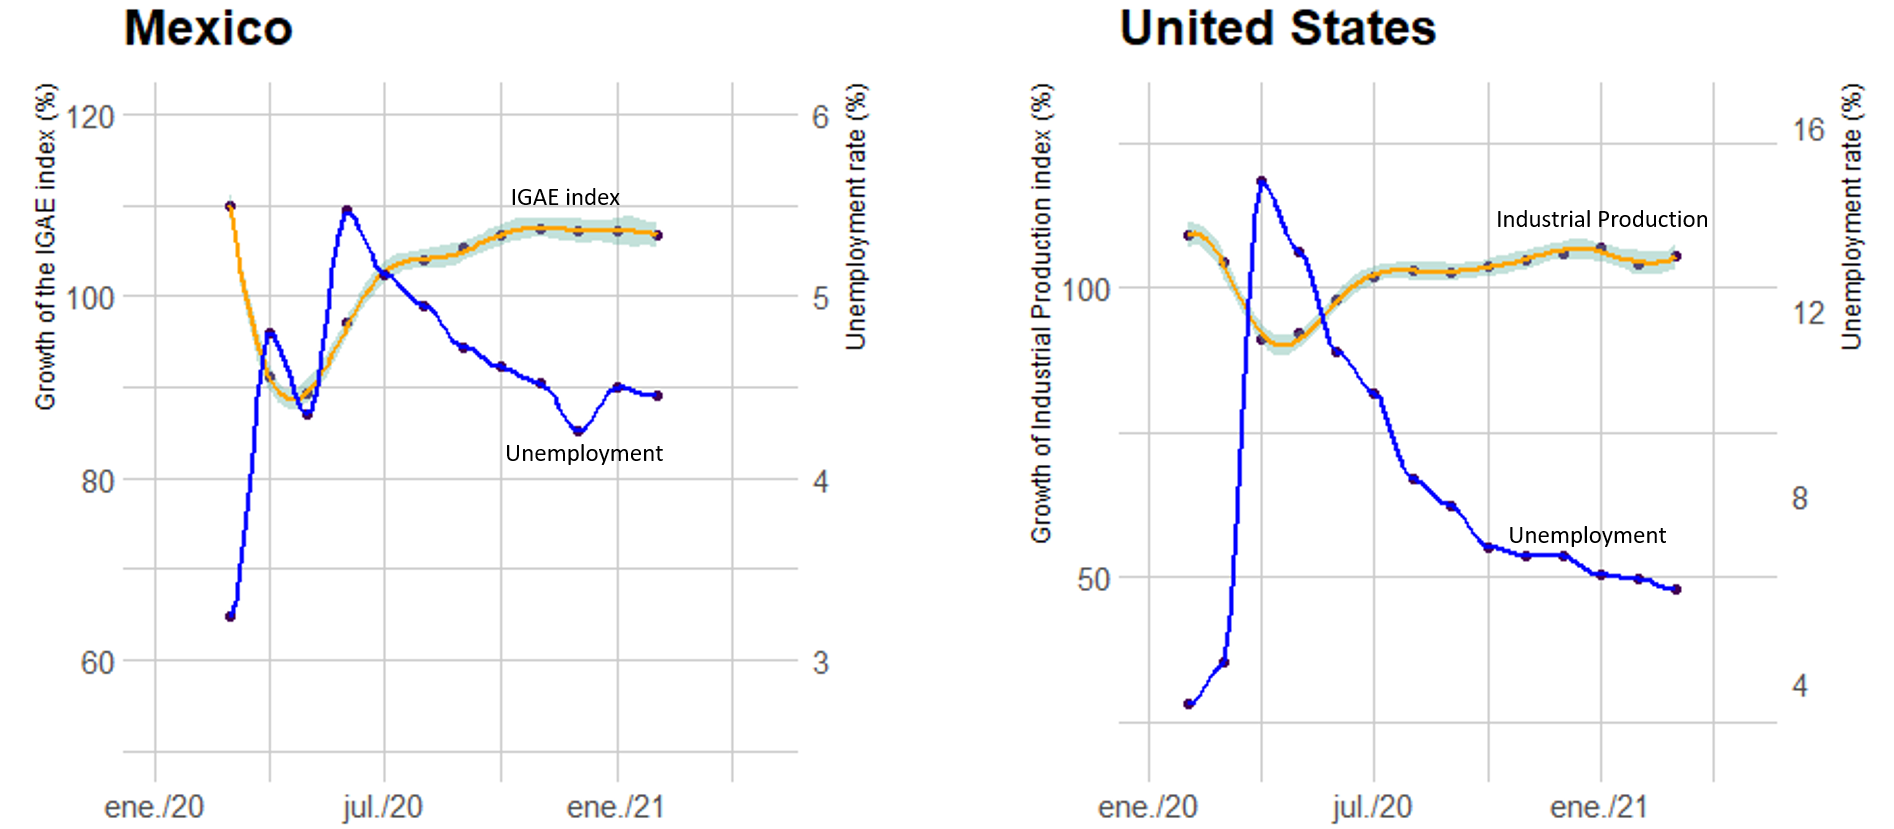
Another economic repercussion attributable to the measures to contain COVID-19 was the increase in the unemployment rate. In Mexico, it went from 3.6% in February 2020 to 5.5% four months later, while in the US went from 3.5% in February 2020 to 14.8% in April of the same year. After these dives, employment in both countries recovered, although the recovery was faster in the US. However, none have reached pre-epidemic levels. Since the impact on unemployment seems broader in the US, it is important to mention a potential underreporting in Mexico caused by a large proportion of the population working in the informal sector.
Figure 2: Comparison between the economic activity index and the unemployment rate.
Data download sites:
Stringency index: https://www.bsg.ox.ac.uk/research/research-projects/covid-19-government-response-tracker
IGAE index: https://www.inegi.org.mx/temas/igae/


